Elkins, AR
Quality of Life, Demographics, And Statistics
HomeSnacks is reader-supported. When you click through real estate links on our site, we earn an affiliate commission. Learn more.
Elkins, Arkansas Info Snack
Table Of Contents
Population
3,139
Unemployment
4.9%
Poverty
8.9%
Median Home
$139,500
Median Income
$65,182
Median Rent
$1,026
Elkins SnackAbility
5
Overall SnackAbility
Overall SnackAbility
Jobs
8/10
Housing
8
Affordability
8
Diversity
5
Safety
6
Amenities
6
Education
8
Commute
5
Elkins, AR Crime Report
51
Total Crimes
Total Crimes
1,571.2
Total Crimes / 100k People
Total Crimes / 100k People
-36.56%
Below National Average
Below National Average
| Statistic | Count Raw |
Elkins / 100k People |
Arkansas / 100k People |
National / 100k People |
|---|---|---|---|---|
| Total Crimes Per 100K | 51 | 1,571.2 | 3,442.7 | 2,476.7 |
| Violent Crime | 24 | 739.4 | 584.6 | 366.7 |
| Murder | 0 | 0.0 | 8.0 | 5.0 |
| Robbery | 0 | 0.0 | 51.6 | 81.6 |
| Aggravated Assault | 15 | 462.1 | 447.8 | 250.2 |
| Property Crime | 27 | 831.8 | 2,858.0 | 2,109.9 |
| Burglary | 3 | 92.4 | 599.6 | 340.5 |
| Larceny | 22 | 677.8 | 2,012.6 | 1,549.5 |
| Car Theft | 2 | 61.6 | 245.9 | 219.9 |
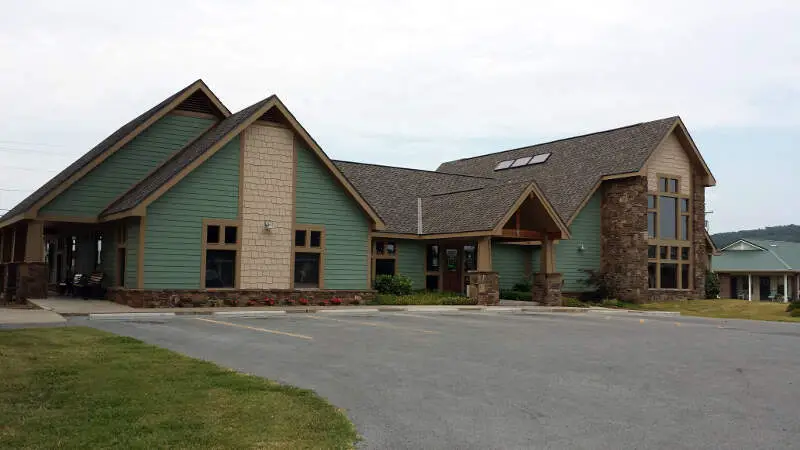
Elkins, AR Photos

Source: Wikipedia User Brandonrush | CC BY-SA 3.0
Source: Wikipedia User Brandonrush | CC BY-SA 3.0
Rankings for Elkins in Arkansas


Map Of Elkins, AR
Best Places Around Elkins
1
Springdale, AR
Population 79,598
2
Rogers, AR
Population 66,344
3
Bentonville, AR
Population 49,467
4
Van Buren, AR
Population 23,413
5
Fayetteville, AR
Population 85,166
6
Siloam Springs, AR
Population 16,715
7
Centerton, AR
Population 14,203
8
Lowell, AR
Population 9,175
9
Farmington, AR
Population 6,992
Population over time in Elkins
| Year | Population | % Change |
|---|---|---|
| 2019 | 3,139 | 3.8% |
| 2018 | 3,023 | 2.5% |
| 2017 | 2,948 | 2.8% |
| 2016 | 2,867 | 1.2% |
| 2015 | 2,832 | 2.6% |
| 2014 | 2,759 | 2.1% |
| 2013 | 2,702 | 2.9% |
| 2012 | 2,626 | 4.2% |
| 2011 | 2,520 | 3.7% |
| 2010 | 2,430 | - |
Race / Ethnicity in Elkins
| Race | Elkins | AR | USA |
|---|---|---|---|
| White | 90.7% | 72.4% | 60.7% |
| African American | 0.3% | 15.2% | 12.3% |
| American Indian | 0.4% | 0.6% | 0.7% |
| Asian | 0.4% | 1.5% | 5.5% |
| Hawaiian | 0.0% | 0.3% | 0.2% |
| Other | 0.0% | 0.2% | 0.2% |
| Two Or More | 1.0% | 2.3% | 2.4% |
| Hispanic | 7.3% | 7.5% | 18.0% |
Gender in Elkins
| Gender | Elkins | AR | USA |
|---|---|---|---|
| Female | 51.0% | 50.9% | 50.8% |
| Male | 49.0% | 49.1% | 49.2% |
Highest level of educational attainment in Elkins for adults over 25
| Education | Elkins | AR | USA |
|---|---|---|---|
| < 9th Grade | 6.0% | 5.0% | 6.0% |
| 9-12th Grade | 3.0% | 9.0% | 7.0% |
| High School / GED | 33.0% | 34.0% | 27.0% |
| Some College | 28.0% | 22.0% | 20.0% |
| Associate's Degree | 5.0% | 7.0% | 8.0% |
| Bachelor's Degree | 18.0% | 15.0% | 20.0% |
| Master's Degree | 5.0% | 6.0% | 9.0% |
| Professional Degree | 1.0% | 1.0% | 2.0% |
| Doctorate Degree | 1.0% | 1.0% | 1.0% |
Household Income For Elkins, Arkansas
| Income | Elkins | AR | USA |
|---|---|---|---|
| Less than $10,000 | 4.3% | 7.8% | 6.0% |
| $10,000 to $14,999 | 5.2% | 6.0% | 4.3% |
| $15,000 to $24,999 | 3.9% | 12.3% | 8.9% |
| $25,000 to $34,999 | 9.5% | 11.6% | 8.9% |
| $35,000 to $49,999 | 12.7% | 14.5% | 12.3% |
| $50,000 to $74,999 | 25.6% | 18.1% | 17.2% |
| $75,000 to $99,999 | 14.9% | 11.2% | 12.7% |
| $100,000 to $149,999 | 19.3% | 11.3% | 15.1% |
| $150,000 to $199,999 | 4.6% | 3.7% | 6.8% |
| $200,000 or more | 0.0% | 3.6% | 7.7% |


