Prescott, AZ
Demographics And Statistics
Living In Prescott, Arizona Summary
Life in Prescott research summary. HomeSnacks has been using Saturday Night Science to research the quality of life in Prescott over the past nine years using Census, FBI, Zillow, and other primary data sources. Based on the most recently available data, we found the following about life in Prescott:
The population in Prescott is 46,054.
The median home value in Prescott is $591,042.
The median income in Prescott is $66,330.
The cost of living in Prescott is 112 which is 1.1x higher than the national average.
The median rent in Prescott is $1,085.
The unemployment rate in Prescott is 5.2%.
The poverty rate in Prescott is 11.3%.
The average high in Prescott is 73.9° and the average low is 43.6°.
Prescott SnackAbility
Overall SnackAbility
Prescott, AZ Crime Report
Crime in Prescott summary. We use data from the FBI to determine the crime rates in Prescott. Key points include:
There were 828 total crimes in Prescott in the last reporting year.
The overall crime rate per 100,000 people in Prescott is 1,729.4 / 100k people.
The violent crime rate per 100,000 people in Prescott is 401.0 / 100k people.
The property crime rate per 100,000 people in Prescott is 1,328.4 / 100k people.
Overall, crime in Prescott is -25.59% below the national average.
Total Crimes
Below National Average
Crime In Prescott Comparison Table
| Statistic | Count Raw |
Prescott / 100k People |
Arizona / 100k People |
National / 100k People |
|---|---|---|---|---|
| Total Crimes Per 100K | 828 | 1,729.4 | 2,712.5 | 2,324.2 |
| Violent Crime | 192 | 401.0 | 484.8 | 369.8 |
| Murder | 1 | 2.1 | 6.9 | 6.3 |
| Robbery | 8 | 16.7 | 83.7 | 66.1 |
| Aggravated Assault | 162 | 338.4 | 350.2 | 268.2 |
| Property Crime | 636 | 1,328.4 | 2,227.7 | 1,954.4 |
| Burglary | 127 | 265.3 | 330.0 | 269.8 |
| Larceny | 474 | 990.0 | 1,656.0 | 1,401.9 |
| Car Theft | 35 | 73.1 | 241.7 | 282.7 |
Prescott, AZ Cost Of Living
Cost of living in Prescott summary. We use data on the cost of living to determine how expensive it is to live in Prescott. Real estate prices drive most of the variance in cost of living around Arizona. Key points include:
The cost of living in Prescott is 112 with 100 being average.
The cost of living in Prescott is 1.1x higher than the national average.
The median home value in Prescott is $591,042.
The median income in Prescott is $66,330.
Prescott's Overall Cost Of Living
Higher Than The National Average
Cost Of Living In Prescott Comparison Table
| Living Expense | Prescott | Arizona | National Average | |
|---|---|---|---|---|
| Overall | 112 | 107 | 100 | |
| Services | 109 | 102 | 100 | |
| Groceries | 103 | 101 | 100 | |
| Health | 94 | 94 | 100 | |
| Housing | 134 | 121 | 100 | |
| Transportation | 110 | 105 | 100 | |
| Utilities | 91 | 97 | 100 | |
Prescott, AZ Weather
The average high in Prescott is 73.9° and the average low is 43.6°.
There are 34.4 days of precipitation each year.
Expect an average of 15.8 inches of precipitation each year with 7.9 inches of snow.
| Stat | Prescott |
|---|---|
| Average Annual High | 73.9 |
| Average Annual Low | 43.6 |
| Annual Precipitation Days | 34.4 |
| Average Annual Precipitation | 15.8 |
| Average Annual Snowfall | 7.9 |
Average High
Days of Rain
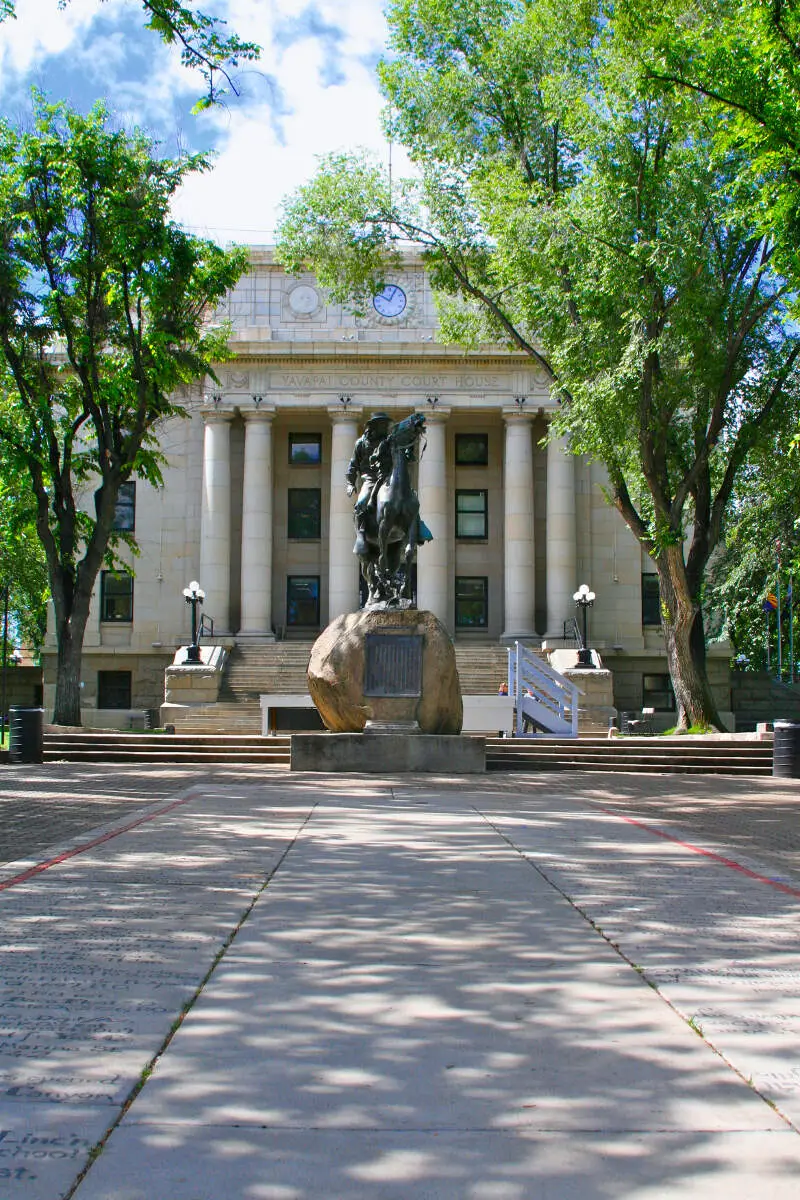
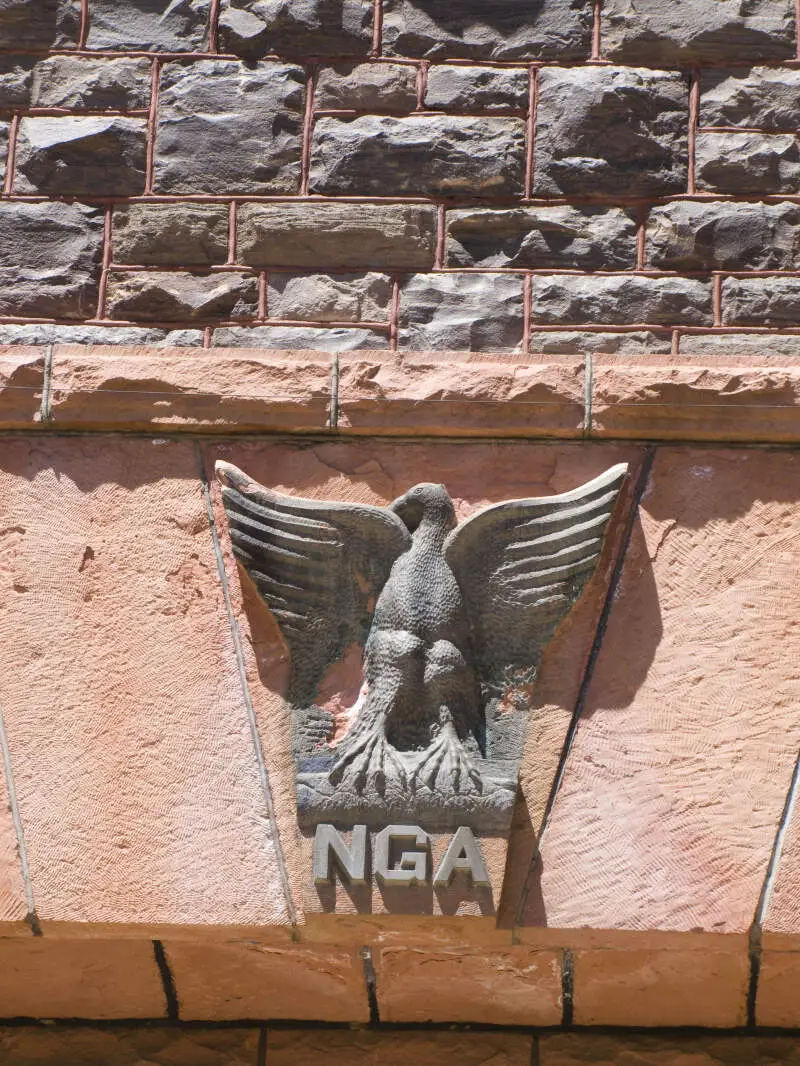
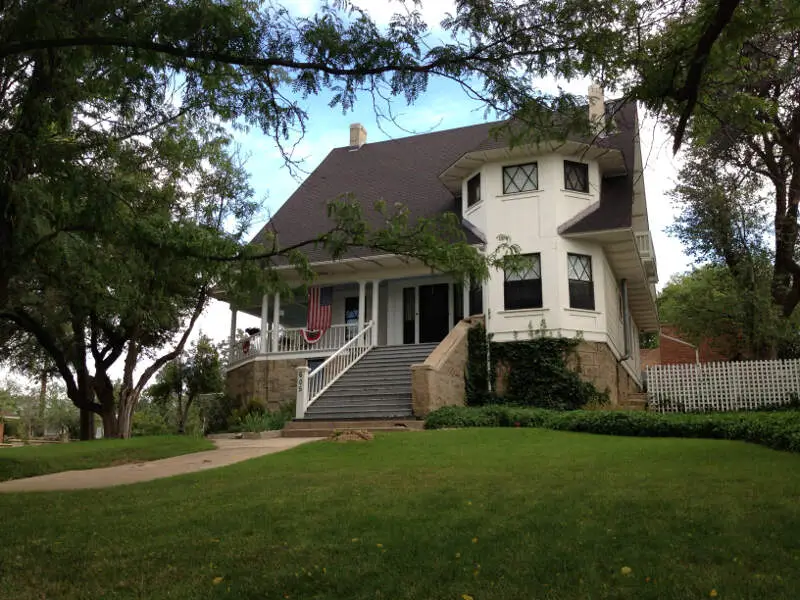
Prescott, AZ Photos


3 Reviews & Comments About Prescott
/5


HomeSnacks User - 2018-07-14 00:33:58.519430
We went to Apple Creek Cottages for the week of 4th of July. The place was so cute and quaint. I love that there is a town center. The hotel was fantastic too...they are dog friendly, which made our life so much easier. A lot of the restaurants in Prescott were also dog friendly, which surprised me. I live in Los Angeles and this is such a nice get away. It feels like a town you would see in tv shows or movies, not a place that really exists.
Look for dog friendly places...if you like dogs you can bring yours with you and not have to leave your fur baby at home, and if you don't then you know where to avoid. Also the rodeo they do every 4th of July was a blast and the Pulled Pork BBQ was amazing!!!


HomeSnacks User - 2018-09-06 02:00:14.586832
Of all the places I've been to and lived in so far, in America, I loved the small town charm and beautiful landscapes of Prescott. I had so much fun in the Dells, and even filmed while there because of the majestic beauty. The people were nice and it truly felt like home. I miss it.
The Granite Dells, Hastings media store, and the small natural market. These were my favorite places to visit in Prescott, AZ.


HomeSnacks User - 2019-04-06 04:37:16
1 in 5 homes sits vacant in AZ because there are many people who have vacation homes. Northern AZ is amazing. I was born and raised in PHX and yes, the heat is crazy hot there and crime is bad in certain parts. I live in Prescott, AZ now, where 80% of the population here is from California so if it's that bad why are they leaving Orange County in droves to come here- The weather here is amazing. Usually the lowest it gets in the winter is 40-50 during the day and 80's-low 90's in the summer. I live 2 minutes from several amazing lakes and mountain formations. Other areas of Prescott, AZ have acres and acres of Ponderosa pines. Very low crime.
1 in 5 homes sits vacant in AZ because there are many people who have vacation homes. Northern AZ is amazing. I was born and raised in PHX and yes, the heat is crazy hot there and crime is bad in certain parts. I live in Prescott, AZ now, where 80% of the population here is from California so if it's that bad why are they leaving Orange County in droves to come here- The weather here is amazing. Usually the lowest it gets in the winter is 40-50 during the day and 80's-low 90's in the summer. I live 2 minutes from several amazing lakes and mountain formations. Other areas of Prescott, AZ have acres and acres of Ponderosa pines. Very low crime.
Rankings for Prescott in Arizona
Locations Around Prescott
Map Of Prescott, AZ
Best Places Around Prescott
Village of Oak Creek (Big Park), AZ
Population 5,915
Williamson, AZ
Population 5,999
Sedona, AZ
Population 9,739
Wickenburg, AZ
Population 7,600
Prescott Valley, AZ
Population 47,015
Camp Verde, AZ
Population 12,132
Chino Valley, AZ
Population 13,120
Cottonwood, AZ
Population 12,314
Cottonwood, AZ
Population 12,314
Prescott Demographics And Statistics
Population over time in Prescott
The current population in Prescott is 46,054. The population has increased 15.3% from 2010.
| Year | Population | % Change |
|---|---|---|
| 2022 | 46,054 | 9.5% |
| 2021 | 42,068 | 1.4% |
| 2020 | 41,468 | 0.9% |
| 2019 | 41,090 | 1.0% |
| 2018 | 40,700 | 1.4% |
| 2017 | 40,130 | 0.3% |
| 2016 | 40,003 | 0.2% |
| 2015 | 39,916 | -0.3% |
| 2014 | 40,055 | 0.3% |
| 2013 | 39,938 | - |
Race / Ethnicity in Prescott
Prescott is:
85.6% White with 39,435 White residents.
0.6% African American with 285 African American residents.
0.6% American Indian with 271 American Indian residents.
1.8% Asian with 809 Asian residents.
0.1% Hawaiian with 68 Hawaiian residents.
0.1% Other with 48 Other residents.
2.5% Two Or More with 1,151 Two Or More residents.
8.7% Hispanic with 3,987 Hispanic residents.
| Race | Prescott | AZ | USA |
|---|---|---|---|
| White | 85.6% | 53.0% | 58.9% |
| African American | 0.6% | 4.3% | 12.1% |
| American Indian | 0.6% | 3.5% | 0.6% |
| Asian | 1.8% | 3.3% | 5.7% |
| Hawaiian | 0.1% | 0.2% | 0.2% |
| Other | 0.1% | 0.3% | 0.4% |
| Two Or More | 2.5% | 3.4% | 3.5% |
| Hispanic | 8.7% | 32.0% | 18.7% |
Gender in Prescott
Prescott is 50.9% female with 23,432 female residents.
Prescott is 49.1% male with 22,621 male residents.
| Gender | Prescott | AZ | USA |
|---|---|---|---|
| Female | 50.9% | 50.0% | 50.4% |
| Male | 49.1% | 50.0% | 49.6% |
Highest level of educational attainment in Prescott for adults over 25
-0.0% of adults in Prescott completed < 9th grade.
3.0% of adults in Prescott completed 9-12th grade.
19.0% of adults in Prescott completed high school / ged.
27.0% of adults in Prescott completed some college.
10.0% of adults in Prescott completed associate's degree.
23.0% of adults in Prescott completed bachelor's degree.
12.0% of adults in Prescott completed master's degree.
3.0% of adults in Prescott completed professional degree.
3.0% of adults in Prescott completed doctorate degree.
| Education | Prescott | AZ | USA |
|---|---|---|---|
| < 9th Grade | -0.0% | 5.0% | 4.0% |
| 9-12th Grade | 3.0% | 6.0% | 6.0% |
| High School / GED | 19.0% | 24.0% | 26.0% |
| Some College | 27.0% | 24.0% | 20.0% |
| Associate's Degree | 10.0% | 9.0% | 9.0% |
| Bachelor's Degree | 23.0% | 20.0% | 21.0% |
| Master's Degree | 12.0% | 9.0% | 10.0% |
| Professional Degree | 3.0% | 2.0% | 2.0% |
| Doctorate Degree | 3.0% | 1.0% | 2.0% |
Household Income For Prescott, Arizona
4.6% of households in Prescott earn Less than $10,000.
2.7% of households in Prescott earn $10,000 to $14,999.
9.9% of households in Prescott earn $15,000 to $24,999.
8.9% of households in Prescott earn $25,000 to $34,999.
9.9% of households in Prescott earn $35,000 to $49,999.
20.0% of households in Prescott earn $50,000 to $74,999.
12.3% of households in Prescott earn $75,000 to $99,999.
15.2% of households in Prescott earn $100,000 to $149,999.
7.0% of households in Prescott earn $150,000 to $199,999.
9.4% of households in Prescott earn $200,000 or more.
| Income | Prescott | AZ | USA |
|---|---|---|---|
| Less than $10,000 | 4.6% | 4.9% | 4.9% |
| $10,000 to $14,999 | 2.7% | 3.1% | 3.8% |
| $15,000 to $24,999 | 9.9% | 6.7% | 7.0% |
| $25,000 to $34,999 | 8.9% | 7.7% | 7.4% |
| $35,000 to $49,999 | 9.9% | 11.5% | 10.7% |
| $50,000 to $74,999 | 20.0% | 17.6% | 16.1% |
| $75,000 to $99,999 | 12.3% | 13.7% | 12.8% |
| $100,000 to $149,999 | 15.2% | 17.3% | 17.1% |
| $150,000 to $199,999 | 7.0% | 8.3% | 8.8% |
| $200,000 or more | 9.4% | 9.2% | 11.4% |


