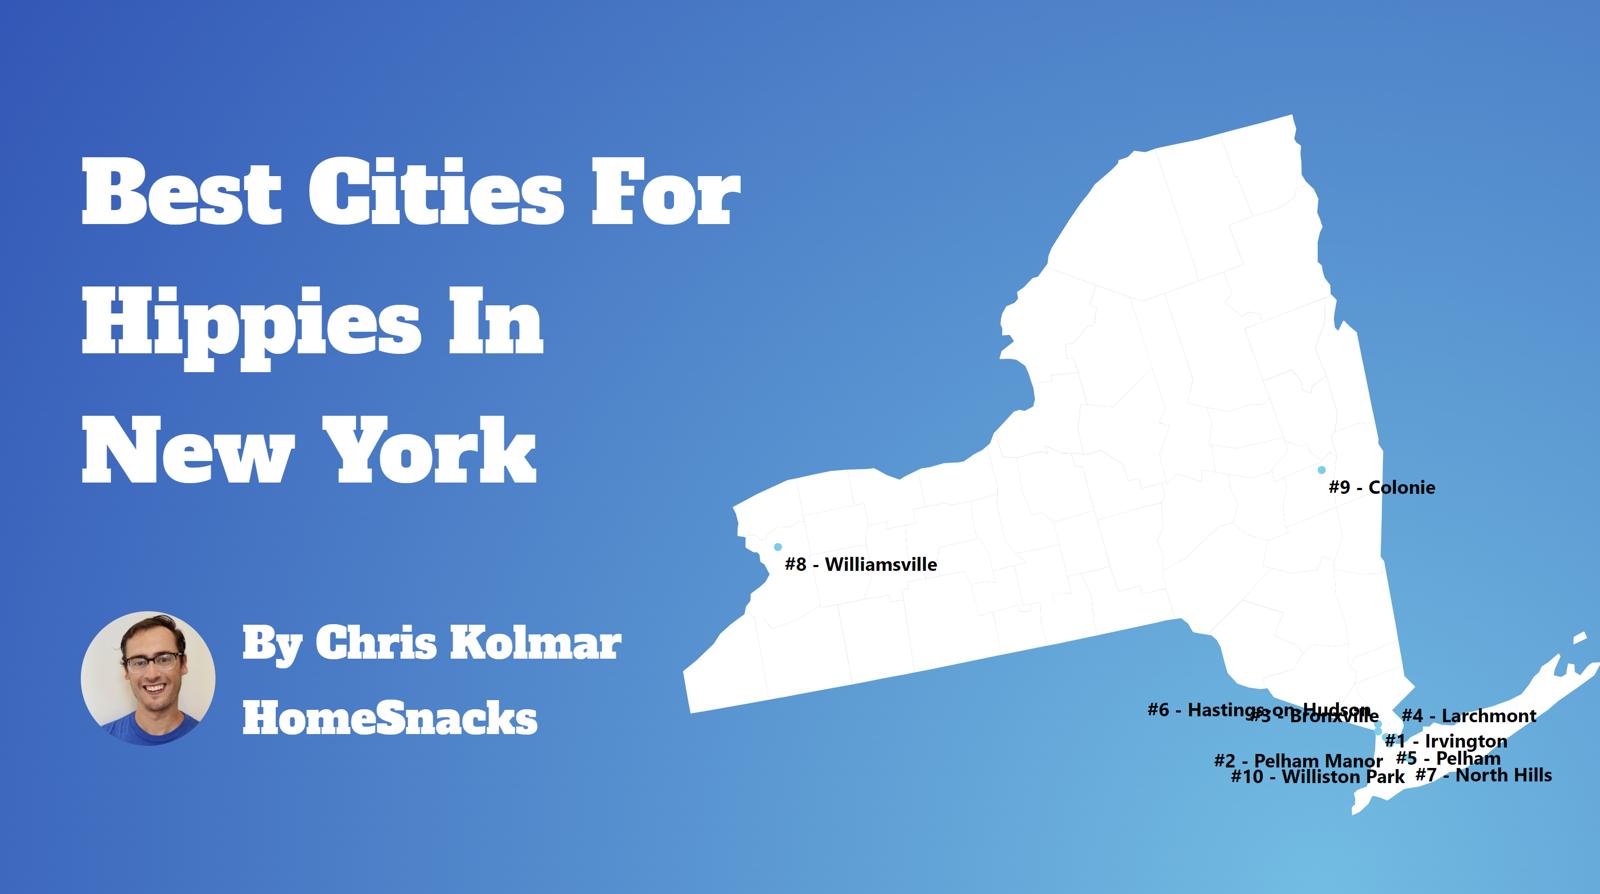
You might think that the whole hippie movement has faded away, but the truth is, there are plenty of hippies out there in New York.
While they aren’t necessarily in your face all the time with war protests, and the next Woodstock isn’t being planned any time soon, we thought it would be fun to look at which cities in the Empire State where the most hippies would live.
And, after crunching the data, you know what? It was spot on.
How do you decide where the most hippies live? By the number of yoga studios, organic markets, and most importantly, where the liberals live in droves.
Using those criteria, it’s not hard to scrape the internet, run some scientific data on where hippies might live in New York, and then put out a list.
So, put on your tie-dye shirt and sandals as you go through this list with us.
Table Of Contents: Top Ten | Methodology | Summary | Table
The 10 Cities In New York With The Largest Hispanic Population For 2024
What’s the hippiest city in New York? The hippiest city in New York is Irvington.
Read on below to see where your town ranked, Young Flower Child.
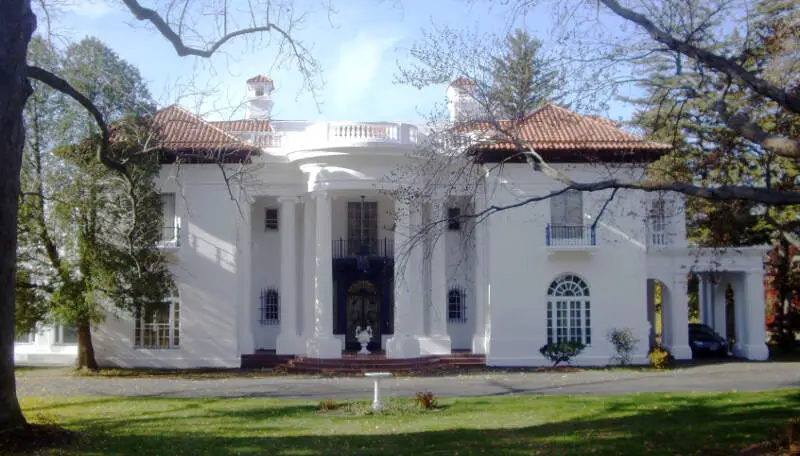
/10
Population: 6,506
% Liberal: 62.0%
More on Irvington: Data | Crime | Cost Of Living | Real Estate
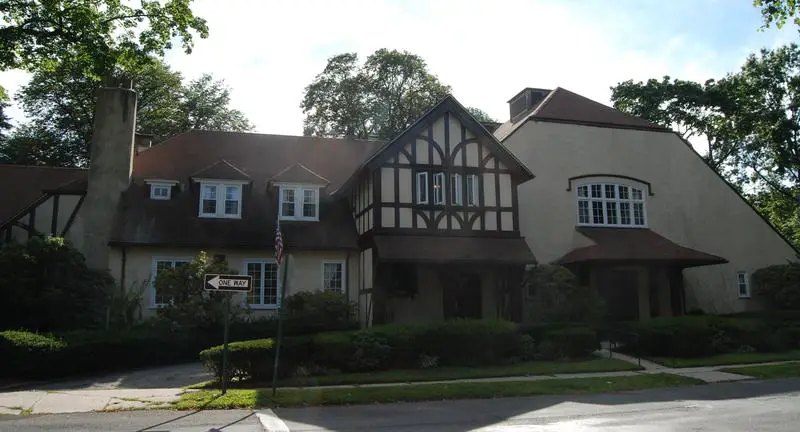
/10
Population: 5,539
% Liberal: 62.0%
More on Pelham Manor: Data | Crime | Cost Of Living | Real Estate
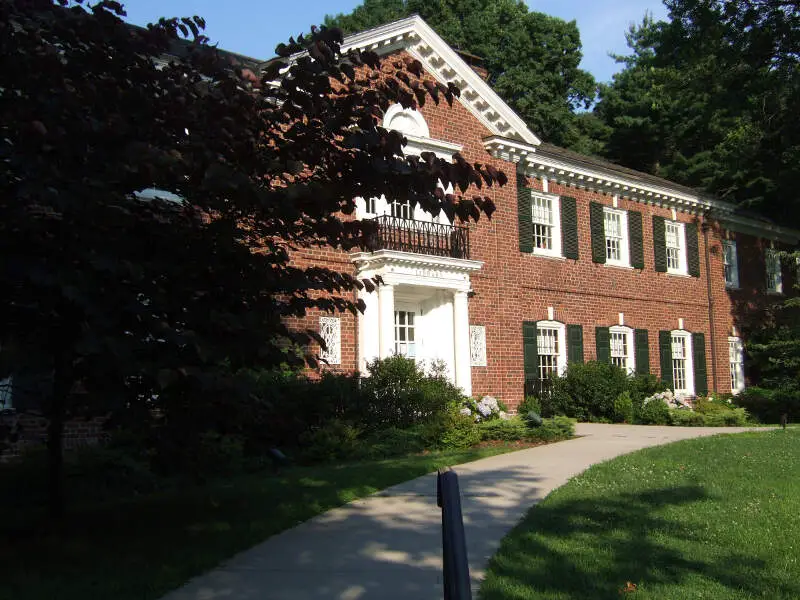
/10
Population: 6,378
% Liberal: 62.0%
More on Bronxville: Data | Crime | Cost Of Living | Real Estate
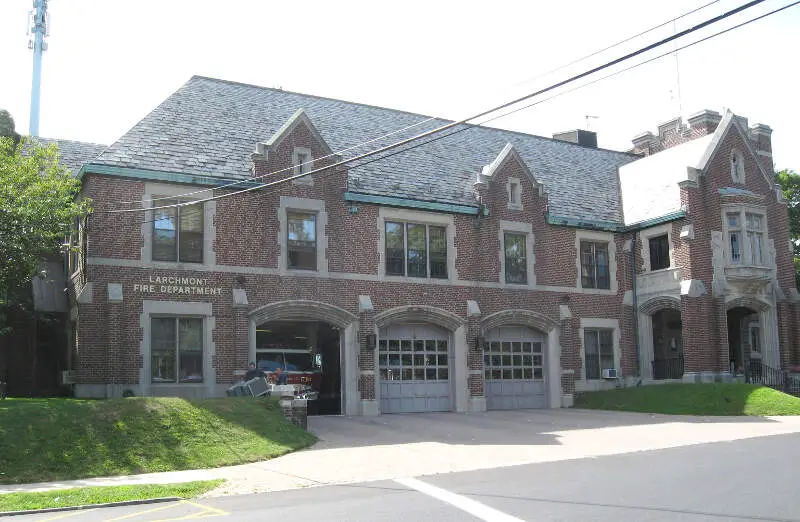
/10
Population: 5,952
% Liberal: 62.0%
More on Larchmont: Data | Crime | Cost Of Living | Real Estate
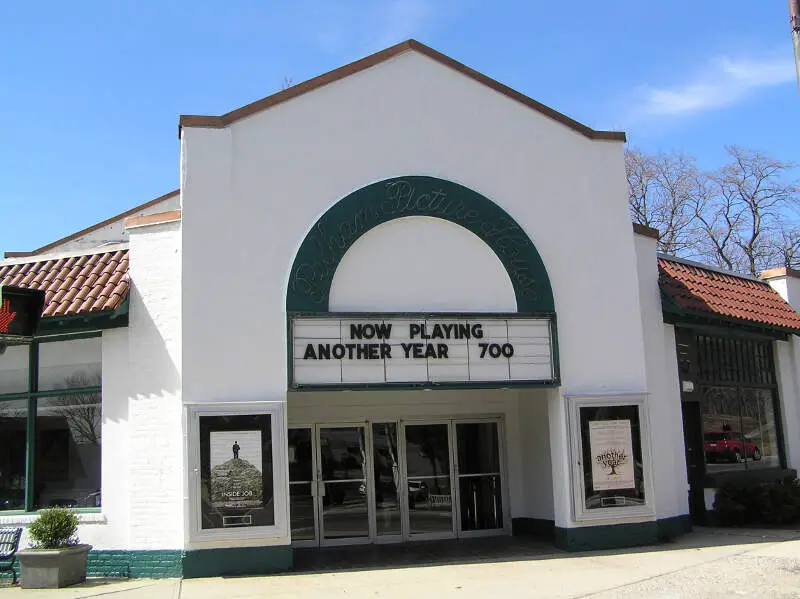
/10
Population: 6,984
% Liberal: 62.0%
More on Pelham: Data | Crime | Cost Of Living | Real Estate
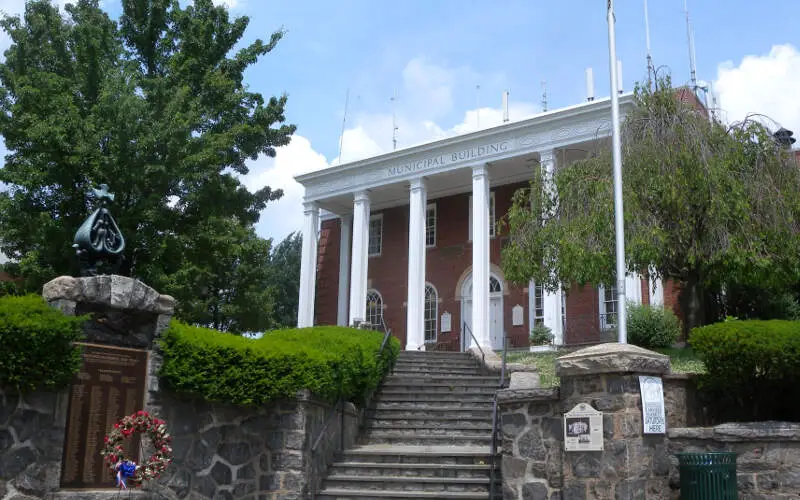
/10
Population: 7,905
% Liberal: 62.0%
More on Hastings-On-Hudson: Data | Crime | Cost Of Living | Real Estate
/10
Population: 5,122
% Liberal: 53.3%
More on North Hills: Data | Cost Of Living | Real Estate
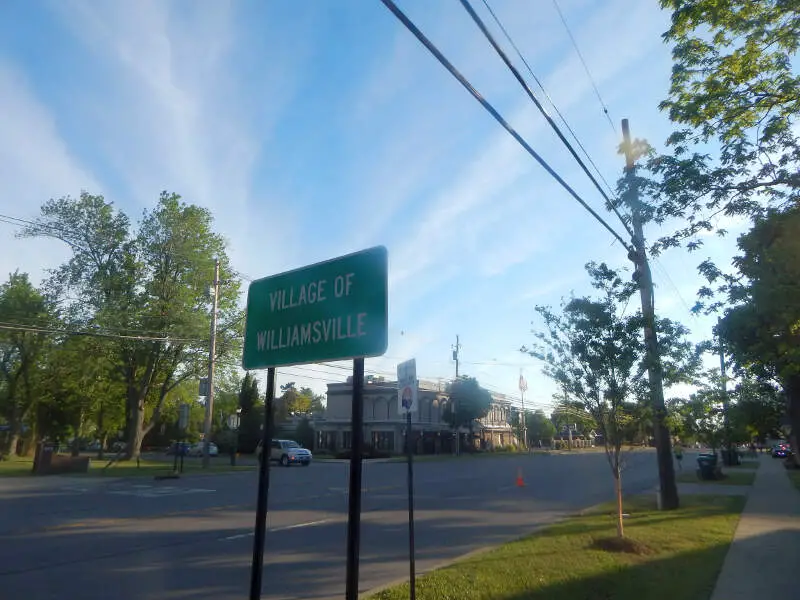
/10
Population: 5,286
% Liberal: 57.3%
More on Williamsville: Data | Cost Of Living | Real Estate

/10
Population: 7,869
% Liberal: 64.5%
More on Colonie: Data | Crime | Cost Of Living | Real Estate
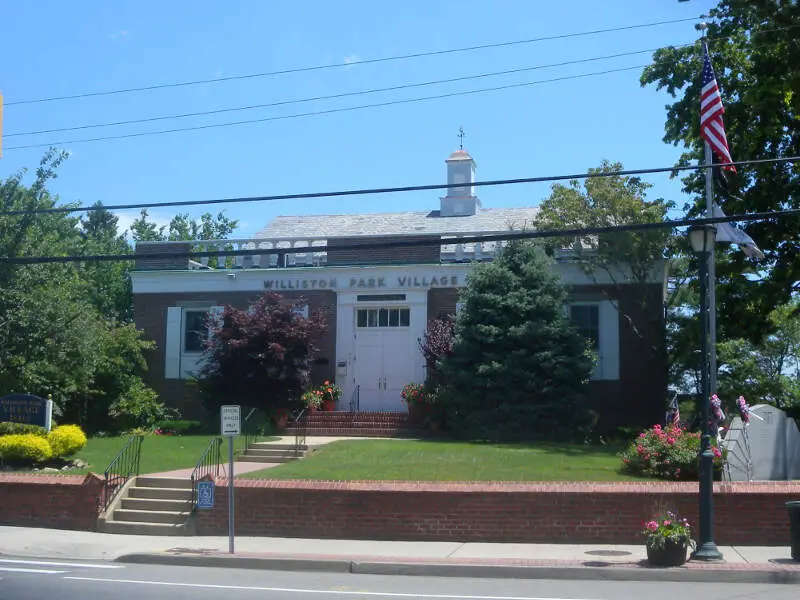
/10
Population: 7,319
% Liberal: 53.3%
More on Williston Park: Data | Cost Of Living | Real Estate
Methodology: How we determined the most beatnik city in New York
In order to rank the best cities for hippies in New York, we used Saturday Night Science to determine what criteria defines a hippie.
We threw a lot of criteria at this one in order to get the best, most complete results possible. Using the Google Places API, the Census’s 2018-2022 American Community Survey, and Voter Registration data, this is the criteria we used:
- Number of yoga studios per capita
- Number of organic markets per capita
- Number of pet adoption centers per capita
- Number of vegan restaurants per capita
- Number of thrift stores per capita
- Each city’s liberal voting population
For the sake of getting reliable numbers on places, we counted any place within a ~4.5 mile radius of a city’s center. The average city in the United States is about 18 square miles.
All of these results are listed in a per capita basis, meaning number of stores per person in a city. Additionally, we limited the analysis to non-CDPs that have over 5,000 people.
We ranked each place with scores from 1 to 169 in each category, where 1 was the most hippie.
Next, we averaged the rankings for each place to create a hippie index.
And finally, we crowned the city with the highest hippie index the “Best City for Hippies In New York.” We’re looking at you, Irvington.
Read on below to learn more about what it’s like to live in hippie central. Or skip to the end to see the list of all the places in the state from hippiest to most square.
Summary: The Hippies Of New York
If you’re measuring the locations in New York where there are lots of liberals, and there are many options for vegan food, yoga and thrift stores, this is an accurate list.
The most hippie cities in New York are Irvington, Pelham Manor, Bronxville, Larchmont, Pelham, Hastings-on-Hudson, North Hills, Williamsville, Colonie, and Williston Park.
If you’re curious, here are the most square places in New York:
- Johnstown
- Rome
- Middletown
For more New York reading, check out:
- Best Places To Live In New York
- Cheapest Places To Live In New York
- Best Places To Raise A Family In New York
- Richest Cities In New York
- Safest Places In New York According To Science
Detailed List Of The Most Hippie Cities In New York
| Rank | City | Population | % Liberal |
|---|---|---|---|
| 1 | Irvington | 6,506 | 62.0% |
| 2 | Pelham Manor | 5,539 | 62.0% |
| 3 | Bronxville | 6,378 | 62.0% |
| 4 | Larchmont | 5,952 | 62.0% |
| 5 | Pelham | 6,984 | 62.0% |
| 6 | Hastings-On-Hudson | 7,905 | 62.0% |
| 7 | North Hills | 5,122 | 53.3% |
| 8 | Williamsville | 5,286 | 57.3% |
| 9 | Colonie | 7,869 | 64.5% |
| 10 | Williston Park | 7,319 | 53.3% |
| 11 | Sea Cliff | 5,012 | 53.3% |
| 12 | Great Neck Plaza | 6,823 | 53.3% |
| 13 | Dobbs Ferry | 11,001 | 62.0% |
| 14 | Lawrence | 6,511 | 53.3% |
| 15 | East Hills | 7,025 | 53.3% |
| 16 | Malverne | 8,544 | 53.3% |
| 17 | Kings Point | 5,076 | 53.3% |
| 18 | New Hyde Park | 9,764 | 53.3% |
| 19 | Nyack | 6,857 | 52.8% |
| 20 | Manorhaven | 6,638 | 53.3% |
| 21 | Cedarhurst | 6,631 | 53.3% |
| 22 | Solvay | 6,514 | 59.7% |
| 23 | East Rockaway | 9,861 | 53.3% |
| 24 | Rensselaer | 9,476 | 55.0% |
| 25 | Briarcliff Manor | 7,783 | 62.0% |
| 26 | Watervliet | 10,250 | 64.5% |
| 27 | Sleepy Hollow | 10,002 | 62.0% |
| 28 | Farmingdale | 8,306 | 53.3% |
| 29 | Wappingers Falls | 5,377 | 52.8% |
| 30 | Hudson | 6,658 | 55.7% |
| 31 | North Syracuse | 6,659 | 59.7% |
| 32 | Kenmore | 15,334 | 57.3% |
| 33 | Scotia | 7,742 | 56.7% |
| 34 | New Hempstead | 5,240 | 52.8% |
| 35 | Great Neck | 10,052 | 53.3% |
| 36 | Fairport | 5,364 | 58.0% |
| 37 | Pleasantville | 7,090 | 62.0% |
| 38 | Webster | 5,528 | 58.0% |
| 39 | Westbury | 15,201 | 53.3% |
| 40 | Rye Brook | 9,456 | 62.0% |
| 41 | Mount Kisco | 11,016 | 62.0% |
| 42 | Floral Park | 16,190 | 53.3% |
| 43 | Bayville | 6,724 | 53.3% |
| 44 | Scarsdale | 17,471 | 62.0% |
| 45 | Mineola | 18,918 | 53.3% |
| 46 | East Rochester | 6,687 | 58.0% |
| 47 | New Square | 7,328 | 52.8% |
| 48 | Chestnut Ridge | 8,035 | 52.8% |
| 49 | Northport | 7,417 | 51.2% |
| 50 | Mamaroneck | 19,133 | 62.0% |
| 51 | New Paltz | 6,945 | 60.0% |
| 52 | Lake Grove | 11,235 | 51.2% |
| 53 | Lynbrook | 19,517 | 53.3% |
| 54 | Beacon | 14,437 | 52.8% |
| 55 | Hudson Falls | 7,266 | 49.9% |
| 56 | Rockville Centre | 24,128 | 53.3% |
| 57 | Wesley Hills | 5,779 | 52.8% |
| 58 | Depew | 15,262 | 57.3% |
| 59 | Amityville | 9,551 | 51.2% |
| 60 | Cohoes | 16,195 | 64.5% |
| 61 | Airmont | 8,770 | 52.8% |
| 62 | Croton-On-Hudson | 8,168 | 62.0% |
| 63 | Lancaster | 10,314 | 57.3% |
| 64 | Massapequa Park | 17,137 | 53.3% |
| 65 | Rye | 15,892 | 62.0% |
| 66 | Kingston | 23,707 | 60.0% |
| 67 | Babylon | 12,177 | 51.2% |
| 68 | Lackawanna | 18,037 | 57.3% |
| 69 | Hamburg | 9,482 | 57.3% |
| 70 | Patchogue | 12,045 | 51.2% |
| 71 | Goshen | 5,417 | 52.1% |
| 72 | Harrison | 27,822 | 62.0% |
| 73 | Warwick | 6,783 | 52.1% |
| 74 | Ballston Spa | 5,298 | 50.2% |
| 75 | Monroe | 8,493 | 52.1% |
| 76 | Saranac Lake | 6,055 | 62.1% |
| 77 | Horseheads | 6,593 | 48.0% |
| 78 | Valley Stream | 37,764 | 53.3% |
| 79 | Mechanicville | 5,207 | 50.2% |
| 80 | Port Jefferson | 7,789 | 51.2% |
| 81 | Glens Falls | 14,574 | 50.1% |
| 82 | East Aurora | 6,255 | 57.3% |
| 83 | Ithaca | 30,399 | 68.5% |
| 84 | Hempstead | 54,801 | 53.3% |
| 85 | Baldwinsville | 7,655 | 59.7% |
| 86 | Freeport | 43,168 | 53.3% |
| 87 | Port Chester | 29,275 | 62.0% |
| 88 | Mount Vernon | 67,962 | 62.0% |
| 89 | West Haverstraw | 10,308 | 52.8% |
| 90 | Plattsburgh | 19,840 | 61.9% |
| 91 | Haverstraw | 12,060 | 52.8% |
| 92 | Newburgh | 28,614 | 52.1% |
| 93 | Suffern | 10,864 | 52.8% |
| 94 | Lindenhurst | 27,303 | 51.2% |
| 95 | Poughkeepsie | 30,716 | 52.8% |
| 96 | Monticello | 6,780 | 53.7% |
| 97 | White Plains | 57,505 | 62.0% |
| 98 | Waterloo | 5,178 | 53.5% |
| 99 | Herkimer | 7,752 | 45.0% |
| 100 | Endicott | 13,216 | 51.5% |

