Are you looking for love in California?
Or are you just hoping to hook up with a hot Californian?
Either way, we’ve got you covered here.
If you live in California, there’s a pretty good chance there are a lot of singles in your area. The Golden State has plenty of people over 18 who aren’t married or in a serious relationship.
That’s great news for people who are single and looking to mingle.
So, where are the best cities for singles in California? We used Saturday Night Science to find out.
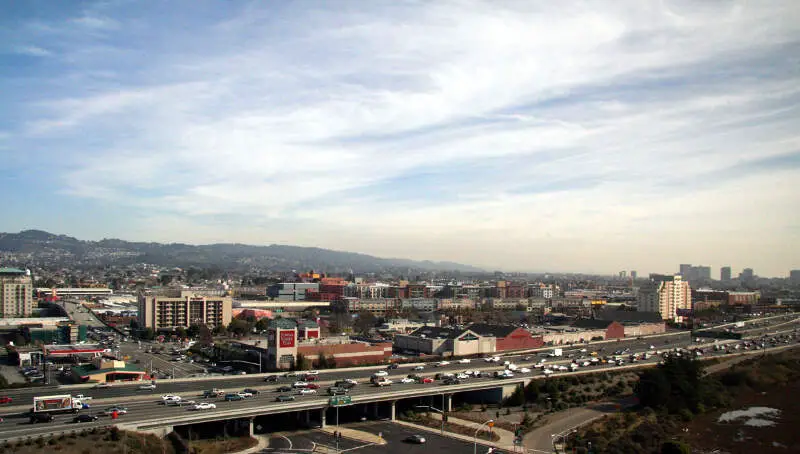
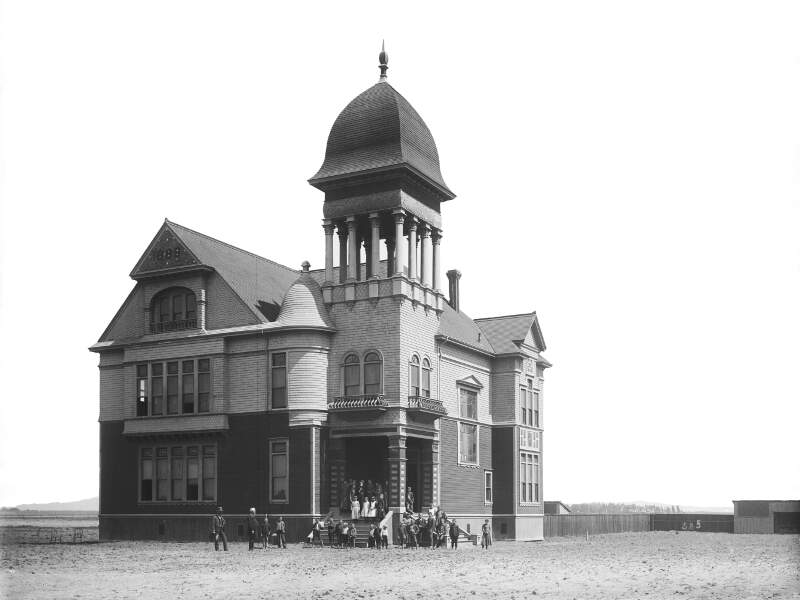
34.5 median age · 8.0% married households
Emeryville is a small city located in northwest Alameda County, California, in the United States. It is located in a corridor between the cities of Berkeley and Oakland, extending to the shore of San Francisco Bay. Its proximity to San Francisco, the Bay Bridge, the University of California, Berkeley, and Silicon Valley has been a catalyst for recent economic growth.
Data | Crime | Cost of living | Movers
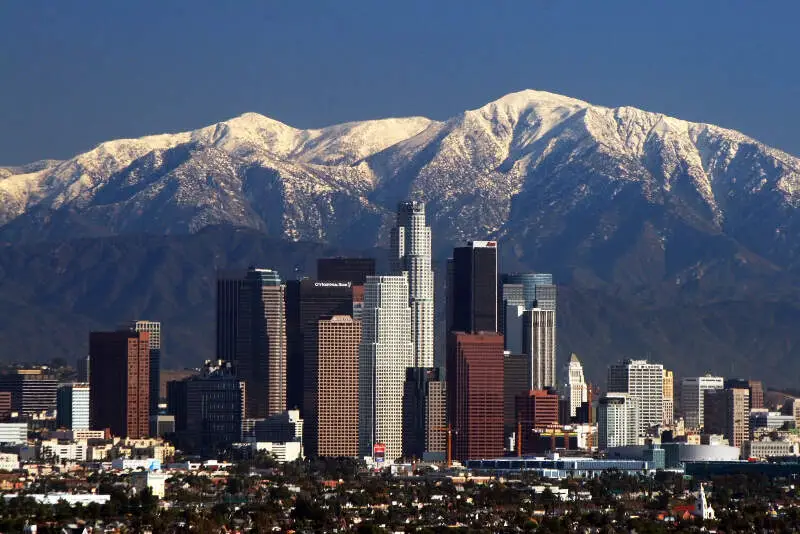
37.2 median age · 10.0% married households
Data | Crime | Cost of living | Movers
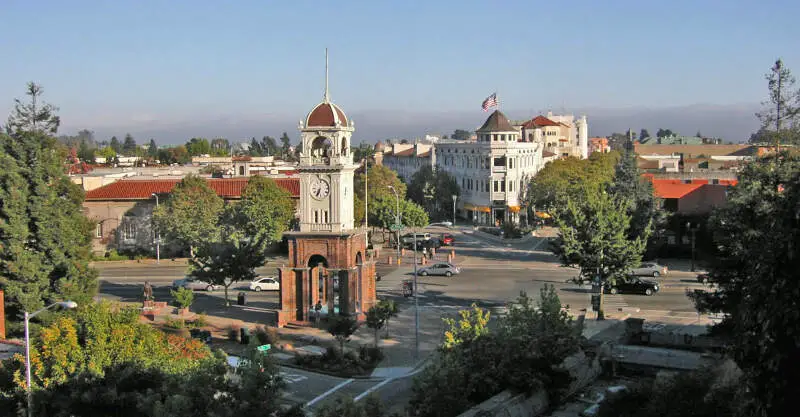
31.1 median age · 14.0% married households
Santa Cruz is the county seat and largest city of Santa Cruz County, California. As of 2013 the U.S. Census Bureau estimated Santa Cruz’s population at 62,864.
Data | Crime | Cost of living | Movers

34.8 median age · 10.0% married households
Hawaiian Gardens is a city in Los Angeles County, California, United States. It is the smallest city in the county and was incorporated on April 9, 1964. The population was 14,254 at the 2010 census, down from 14,779 at the 2000 census.
Data | Crime | Cost of living | Movers
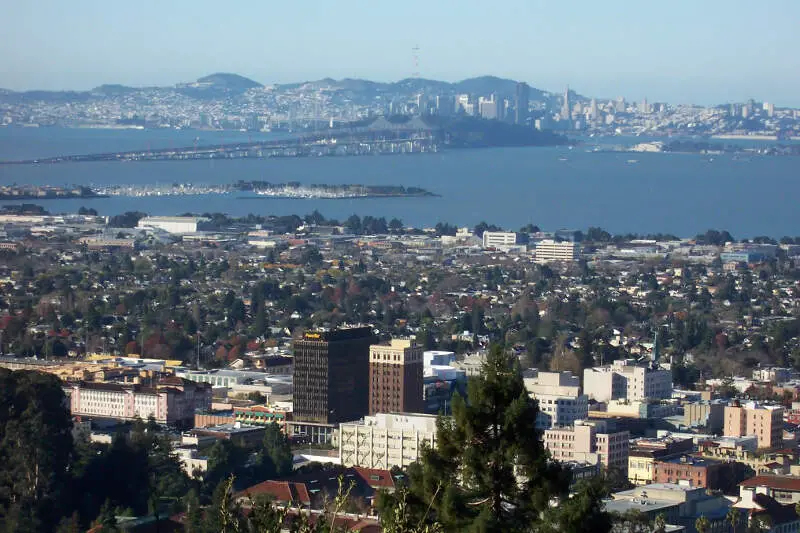
33.2 median age · 10.0% married households
Berkeley is a city on the east shore of San Francisco Bay in northern Alameda County, California. It is named after the 18th-century Anglo-Irish bishop and philosopher George Berkeley. It borders the cities of Oakland and Emeryville to the south and the city of Albany and the unincorporated community of Kensington to the north. Its eastern border with Contra Costa County generally follows the ridge of the Berkeley Hills. The 2010 census recorded a population of 112,580.
Data | Crime | Cost of living | Movers
33.4 median age · 9.0% married households
Paramount is a city in Los Angeles County, California, United States. According to the 2010 census, the city had a total population of 54,098, down from 55,266 at the 2000 census. Paramount is part of the Greater Los Angeles Area; and is bordered by Compton and Lynwood to the west, South Gate and Downey to the north, Bellflower to the east and south, and Long Beach to the south.
Data | Crime | Cost of living | Movers
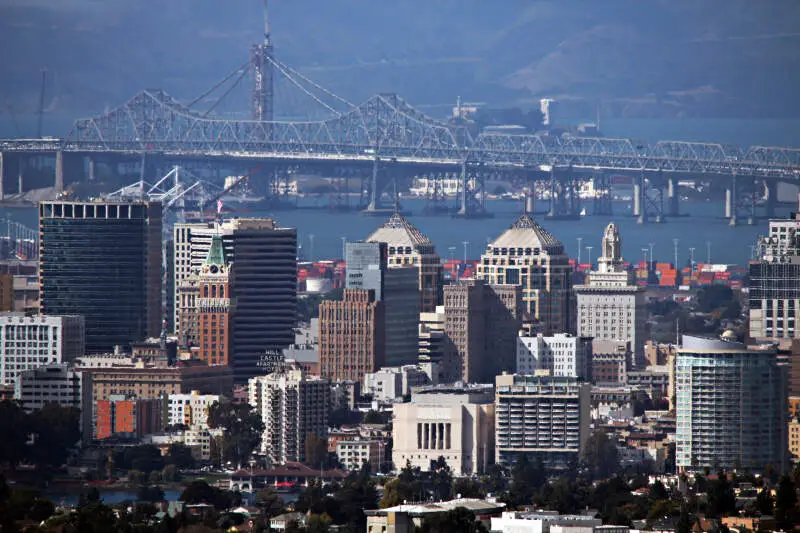
37.9 median age · 12.0% married households
Oakland is the largest city and the county seat of Alameda County, California, United States. A major West Coast port city, Oakland is the largest city in the East Bay region of the San Francisco Bay Area, the third largest city overall in the San Francisco Bay Area, the eighth most populated city in California, and the 45th largest city in the United States. With a population of 419,267 as of 2015, it serves as a trade center for the San Francisco Bay Area; its Port of Oakland is the busiest port in the San Francisco Bay, the entirety of Northern California, and the fifth busiest in the United States of America. The city was incorporated in 1852.
Data | Crime | Cost of living | Movers
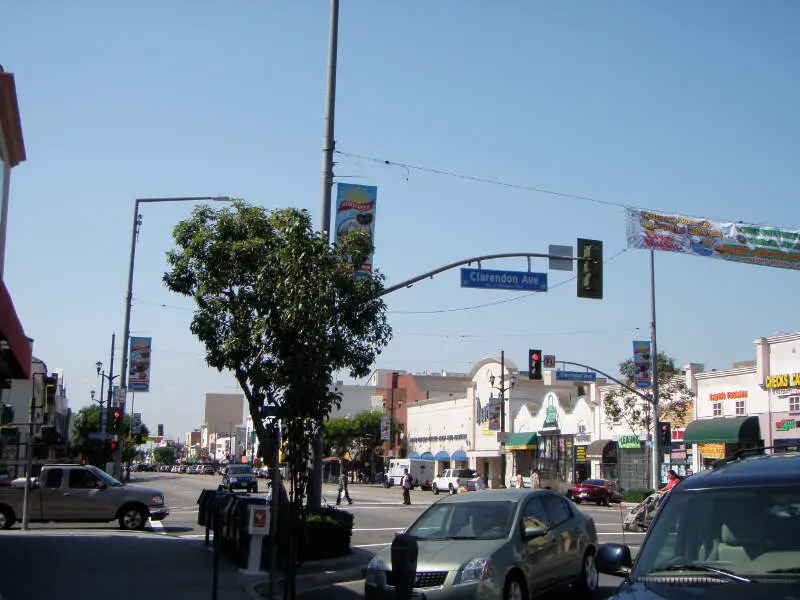
34.6 median age · 7.0% married households
Huntington Park is a city in the Gateway Cities district of southeastern Los Angeles County, California.
Data | Crime | Cost of living | Movers
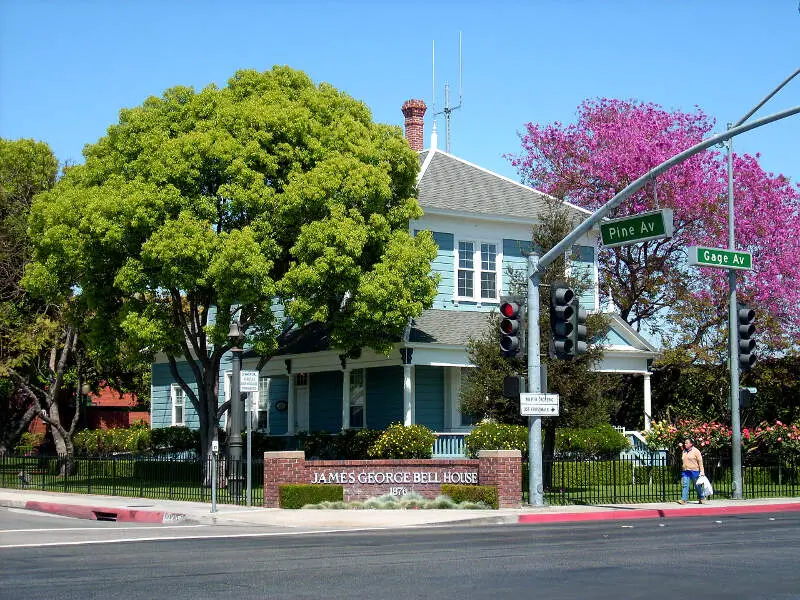
34.3 median age · 7.0% married households
Bell is an incorporated city in Los Angeles County, California, near the center of the former San Antonio Township. Its population was 35,477 at the 2010 census, down from 36,664 in the 2000 census. Bell is located on the west bank of the Los Angeles River and is a suburb of the city of Los Angeles. At 2.5 square miles, Bell is the thirteenth smallest city in the United States with a population of at least 25,000.
Data | Crime | Cost of living | Movers
38.3 median age · 15.0% married households
San Mateo is a city in San Mateo County, California, located in the high-tech enclave of Silicon Valley in the San Francisco Bay Area. With a population of 97,207 as of the 2010 census, it is one of the larger suburbs on the San Francisco Peninsula, located between Burlingame to the north, Foster City and San Francisco Bay to the east, Belmont to the south, and Highlands-Baywood Park and Hillsborough to the west. The 2015 population was estimated to be 103,536. San Mateo was incorporated in 1894.
Data | Crime | Cost of living | Movers
The receipts
Compare the top ten
Pick a metric. The bars rescale. The red line is California’s statewide median.
On the map
Where California’s singles cluster
Saturday Night Science
Methodology: How do you determine which city is best for singles in California anyways?
To give you the places in California which are best for singles to find one another, we used Saturday Night Science to look at a handful of metrics. Of course, we want to measure the type of people who live in each city and make some assumptions about what single people like.
So we researched the internet for a database that contains all that information.
We threw a lot of criteria at this one to get the best, most complete results possible. Using the 2020-2024 American Community Survey Census data produced for the state of California, we looked at every single city in the state. We paid particular attention to:
- Population density
- % of population that’s male vs. female (closer to a 50-50 ratio is better)
- % of households with kids
- Median age
- Number of unmarried people in each city
We then gave each city a “Singles Score.”
The higher the score, the better the city is for singles to find one another. We also limited our results to cities with over 10,000 people. For California, that meant a total of 361 cities.
We updated this article for 2026. This is our eleventh time ranking the best cities for singles in California.
Read on to see why Emeryville is the talk of the town while Norco is probably a bit on the bland side.
The full plate
Best Cities For Singles In California
Click any column to sort. Search by city name.
| Rank | City | Singles Score | Population | Median Age | % Married Households | % Households w/ Kids |
|---|---|---|---|---|---|---|
| 1 | Emeryville | 47.70 | 13,081 | 34.5 | 8.0% | 9.5% |
| 2 | Los Angeles | 64.00 | 3,857,263 | 37.2 | 10.0% | 26.5% |
| 3 | Santa Cruz | 75.40 | 61,607 | 31.1 | 14.0% | 20.1% |
| 4 | Hawaiian Gardens | 80.70 | 13,691 | 34.8 | 10.0% | 38.2% |
| 5 | Berkeley | 82.60 | 120,257 | 33.2 | 10.0% | 18.9% |
| 6 | Paramount | 84.70 | 52,050 | 33.4 | 9.0% | 43.2% |
| 7 | Oakland | 84.80 | 439,418 | 37.9 | 12.0% | 26.0% |
| 8 | Huntington Park | 85.50 | 53,108 | 34.6 | 7.0% | 45.4% |
| 9 | Bell | 91.40 | 32,476 | 34.3 | 7.0% | 43.4% |
| 10 | San Mateo | 98.80 | 103,105 | 38.3 | 15.0% | 27.7% |
| 11 | Bell Gardens | 99.00 | 38,229 | 32.3 | 8.0% | 49.8% |
| 12 | San Francisco | 99.60 | 830,235 | 40.0 | 10.0% | 18.1% |
| 13 | Davis | 101.00 | 66,978 | 26.4 | 15.0% | 20.1% |
| 14 | Watsonville | 101.10 | 51,712 | 33.8 | 13.0% | 41.7% |
| 15 | Long Beach | 102.80 | 455,548 | 37.1 | 15.0% | 27.3% |
| 16 | Garden Grove | 103.90 | 170,964 | 40.2 | 10.0% | 36.9% |
| 17 | San Diego | 105.20 | 1,389,526 | 36.2 | 13.0% | 26.1% |
| 18 | San Pablo | 107.30 | 31,720 | 34.6 | 9.0% | 43.7% |
| 19 | Pomona | 107.70 | 147,943 | 36.0 | 14.0% | 38.0% |
| 20 | Seaside | 109.10 | 31,814 | 34.0 | 13.0% | 34.6% |
| 21 | San Luis Obispo | 109.40 | 48,491 | 26.3 | 16.0% | 13.9% |
| 22 | Hawthorne | 109.70 | 85,191 | 33.9 | 10.0% | 37.0% |
| 23 | Salinas | 111.20 | 161,761 | 32.4 | 13.0% | 46.6% |
| 24 | Mountain View | 112.30 | 83,732 | 35.5 | 8.0% | 27.1% |
| 25 | Pasadena | 112.60 | 136,969 | 40.1 | 14.0% | 22.2% |
| 26 | Santa Clara | 115.60 | 130,256 | 34.6 | 11.0% | 27.6% |
| 27 | Baldwin Park | 116.50 | 70,138 | 38.2 | 9.0% | 40.8% |
| 28 | South El Monte | 116.50 | 19,287 | 37.2 | 9.0% | 41.3% |
| 29 | West Hollywood | 116.70 | 34,884 | 40.0 | 6.0% | 3.4% |
| 30 | Redondo Beach | 117.30 | 69,291 | 41.1 | 17.0% | 29.6% |
| 31 | South San Francisco | 117.70 | 64,305 | 43.2 | 16.0% | 28.8% |
| 32 | Santa Maria | 118.40 | 110,462 | 29.3 | 13.0% | 47.0% |
| 33 | San Bruno | 119.40 | 42,307 | 39.8 | 20.0% | 26.5% |
| 34 | Montebello | 119.80 | 61,045 | 40.1 | 15.0% | 34.2% |
| 35 | Alhambra | 119.90 | 81,022 | 41.5 | 12.0% | 25.9% |
| 36 | Lynwood | 120.10 | 64,578 | 33.6 | 9.0% | 50.1% |
| 37 | Norwalk | 121.20 | 99,789 | 37.3 | 17.0% | 40.3% |
| 38 | Westminster | 121.80 | 89,860 | 43.2 | 12.0% | 33.6% |
| 39 | Cudahy | 121.80 | 22,087 | 30.7 | 9.0% | 47.2% |
| 40 | South Gate | 121.90 | 91,483 | 36.3 | 11.0% | 41.6% |
| 41 | Sunnyvale | 122.00 | 154,236 | 35.2 | 9.0% | 29.0% |
| 42 | Torrance | 122.70 | 142,130 | 43.2 | 18.0% | 29.2% |
| 43 | East Palo Alto | 123.20 | 29,069 | 36.3 | 9.0% | 32.9% |
| 44 | Arcata | 123.20 | 18,607 | 28.1 | 10.0% | 18.4% |
| 45 | El Cajon | 123.30 | 104,449 | 36.1 | 15.0% | 37.6% |
| 46 | Azusa | 123.30 | 49,031 | 34.4 | 14.0% | 34.0% |
| 47 | Hermosa Beach | 123.80 | 19,063 | 42.7 | 15.0% | 21.7% |
| 48 | Lawndale | 124.40 | 30,781 | 36.9 | 11.0% | 35.2% |
| 49 | Oxnard | 125.50 | 200,928 | 34.4 | 14.0% | 43.3% |
| 50 | Buena Park | 126.00 | 82,871 | 37.3 | 16.0% | 39.0% |
| 51 | Fountain Valley | 126.10 | 56,258 | 44.4 | 16.0% | 28.9% |
| 52 | Fullerton | 126.60 | 140,968 | 36.9 | 18.0% | 32.2% |
| 53 | Escondido | 126.80 | 149,668 | 36.9 | 16.0% | 34.8% |
| 54 | Sacramento | 126.90 | 528,706 | 36.0 | 18.0% | 29.5% |
| 55 | El Monte | 127.50 | 106,109 | 37.8 | 8.0% | 39.0% |
| 56 | Maywood | 127.90 | 24,317 | 33.4 | 7.0% | 48.3% |
| 57 | Covina | 128.50 | 49,888 | 38.2 | 21.0% | 32.8% |
| 58 | Lemon Grove | 128.60 | 27,686 | 37.1 | 19.0% | 31.7% |
| 59 | El Cerrito | 129.80 | 25,994 | 41.8 | 14.0% | 26.0% |
| 60 | San Bernardino | 129.90 | 222,724 | 32.2 | 16.0% | 43.3% |
| 61 | Anaheim | 130.30 | 344,521 | 36.2 | 14.0% | 35.8% |
| 62 | Inglewood | 130.90 | 104,569 | 38.6 | 11.0% | 29.6% |
| 63 | Tustin | 131.10 | 78,981 | 37.5 | 15.0% | 33.2% |
| 64 | Costa Mesa | 132.10 | 110,330 | 36.7 | 19.0% | 26.2% |
| 65 | Santa Ana | 132.70 | 312,534 | 34.7 | 11.0% | 42.1% |
| 66 | San Leandro | 134.20 | 87,826 | 41.9 | 15.0% | 29.1% |
| 67 | Merced | 134.30 | 91,953 | 30.0 | 17.0% | 42.0% |
| 68 | San Jose | 134.50 | 990,138 | 38.2 | 12.0% | 33.5% |
| 69 | Santa Monica | 134.80 | 91,169 | 42.7 | 10.0% | 14.5% |
| 70 | Santa Barbara | 134.80 | 87,779 | 39.7 | 17.0% | 23.4% |
| 71 | Compton | 135.00 | 92,698 | 33.3 | 12.0% | 45.6% |
| 72 | Hayward | 135.50 | 158,801 | 38.6 | 11.0% | 34.6% |
| 73 | Fresno | 136.10 | 545,970 | 32.8 | 21.0% | 37.7% |
| 74 | Rosemead | 136.10 | 50,013 | 44.6 | 6.0% | 30.9% |
| 75 | Cerritos | 136.40 | 47,867 | 47.7 | 13.0% | 29.8% |
| 76 | Glendale | 136.70 | 190,748 | 41.4 | 9.0% | 27.5% |
| 77 | Oceanside | 137.30 | 172,242 | 38.9 | 18.0% | 28.5% |
| 78 | South Pasadena | 138.20 | 26,068 | 40.5 | 21.0% | 33.6% |
| 79 | La Habra | 139.90 | 61,970 | 38.3 | 24.0% | 33.9% |
| 80 | El Centro | 140.10 | 44,240 | 31.0 | 16.0% | 41.5% |
| 81 | Belmont | 140.20 | 27,337 | 39.8 | 18.0% | 35.6% |
| 82 | Montclair | 140.30 | 37,810 | 33.7 | 16.0% | 40.2% |
| 83 | Monterey | 141.00 | 29,613 | 37.5 | 18.0% | 20.3% |
| 84 | Huntington Beach | 141.30 | 195,240 | 44.0 | 23.0% | 23.9% |
| 85 | Imperial Beach | 141.60 | 25,764 | 35.1 | 16.0% | 31.9% |
| 86 | Bellflower | 142.00 | 76,819 | 36.0 | 16.0% | 38.3% |
| 87 | Menlo Park | 142.20 | 32,727 | 39.5 | 14.0% | 31.2% |
| 88 | Selma | 142.70 | 24,659 | 32.9 | 17.0% | 43.7% |
| 89 | Chico | 142.80 | 102,188 | 31.1 | 21.0% | 24.5% |
| 90 | Marina | 143.20 | 22,563 | 36.9 | 18.0% | 29.8% |
| 91 | Vista | 143.30 | 99,114 | 35.9 | 18.0% | 35.5% |
| 92 | Orange | 143.40 | 138,266 | 37.2 | 22.0% | 31.6% |
| 93 | Port Hueneme | 143.80 | 21,582 | 37.8 | 14.0% | 31.9% |
| 94 | Richmond | 144.00 | 115,505 | 37.9 | 11.0% | 32.7% |
| 95 | Commerce | 144.10 | 11,993 | 35.6 | 11.0% | 37.0% |
| 96 | San Buenaventura (Ventura) | 144.50 | 109,857 | 41.3 | 24.0% | 27.0% |
| 97 | Goleta | 145.30 | 32,685 | 36.9 | 20.0% | 27.5% |
| 98 | Irvine | 145.40 | 311,690 | 34.0 | 11.0% | 33.6% |
| 99 | Parlier | 145.90 | 14,507 | 26.6 | 8.0% | 59.6% |
| 100 | Campbell | 146.90 | 42,781 | 39.9 | 17.0% | 29.5% |
Source: U.S. Census ACS 2020-2024. 361 cities with more than 10,000 residents.
Summary
Summary: The Best Cities For Singles In California For 2026
If you’re looking for a breakdown of cities in California ranked by criteria that most agree make a place a great spot for finding a single person (and potentially love), this is an accurate list.
The best cities for singles in California are Emeryville, Los Angeles, Santa Cruz, Hawaiian Gardens, Berkeley, Paramount, Oakland, Huntington Park, Bell, and San Mateo.


