Are you looking for love in Texas?
Or are you just hoping to hook up with a hot Texan?
Either way, we’ve got you covered here.
If you live in Texas, there’s a pretty good chance there are a lot of singles in your area. The Lone Star State has plenty of people over 18 who aren’t married or in a serious relationship.
That’s great news for people who are single and looking to mingle.
So, where are the best cities for singles in Texas? We used Saturday Night Science to find out.
Table Of Contents: Top Ten | Methodology | Summary | Table
The 10 Best Cities For Singles In Texas For 2024
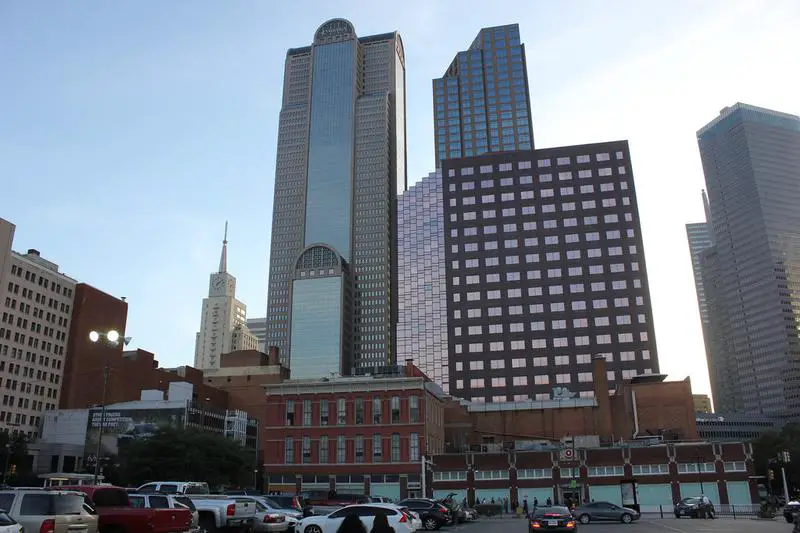
So, what was the best city for singles in Texas? Dallas ranks as the best place for singles in Texas if you care about things singles care about, like nightlife, affordable housing, and other singles.
Read below to see how we crunched the numbers and how each city ranked. If you live in or are close to one of these cities and are single, you should probably get out more often.
Just saying.
For more Texas reading, check out:
The 10 Best Cities For Singles In Texas For 2024
/10
Population: 1,300,642
Median Age: 33.1
Married households: 14.0%
Households with kids: 28.9%
More on Dallas: Data | Crime | Cost Of Living | Real Estate


Dallas is a great place it’s very beautiful and clean the people are very nice and the streets are wide plenty of room
The tall buildings and the sports
/10
Population: 17,026
Median Age: 34.0
Married households: 10.0%
Households with kids: 14.3%
More on Addison: Data | Crime | Cost Of Living | Real Estate
/10
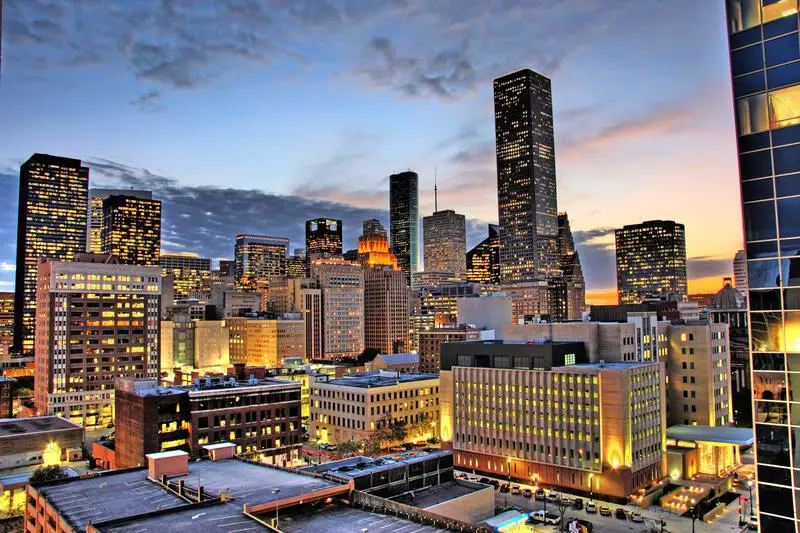
Population: 2,296,253
Median Age: 33.9
Married households: 13.0%
Households with kids: 31.0%
More on Houston: Data | Crime | Cost Of Living | Real Estate


Crime is same as most major cities. It is very cosmopolitan with all sorts of amazing ethnic foods. Cost of living is also pretty good given it is a major city. Lots of job opportunities
Hermann park is lovely as is Discovery Green. There are many food options here for all budgets and easily accessible. There are lot of sporting and cultural activities such as the annual rodeo etc.
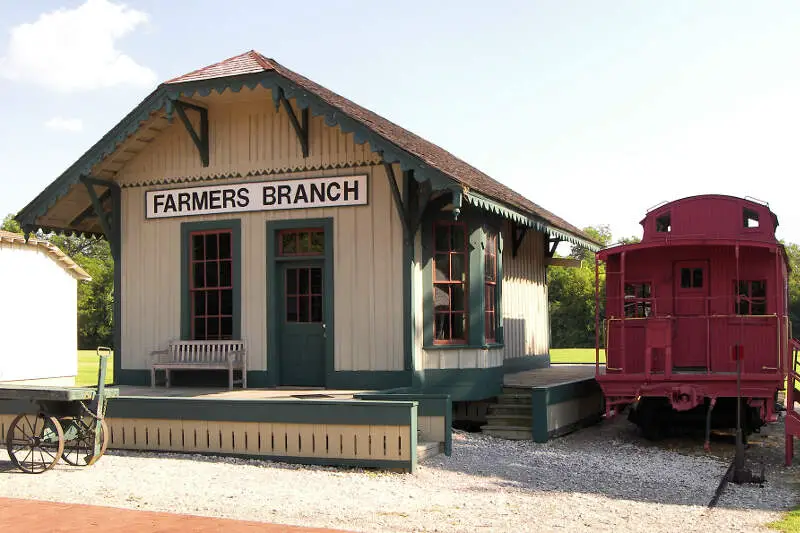
/10
Population: 35,985
Median Age: 34.1
Married households: 13.0%
Households with kids: 26.9%
More on Farmers Branch: Data | Crime | Cost Of Living | Real Estate
/10
Population: 120,451
Median Age: 22.9
Married households: 13.0%
Households with kids: 24.8%
More on College Station: Data | Crime | Cost Of Living | Real Estate
/10
Population: 60,360
Median Age: 34.3
Married households: 15.0%
Households with kids: 31.9%
More on Euless: Data | Crime | Cost Of Living | Real Estate
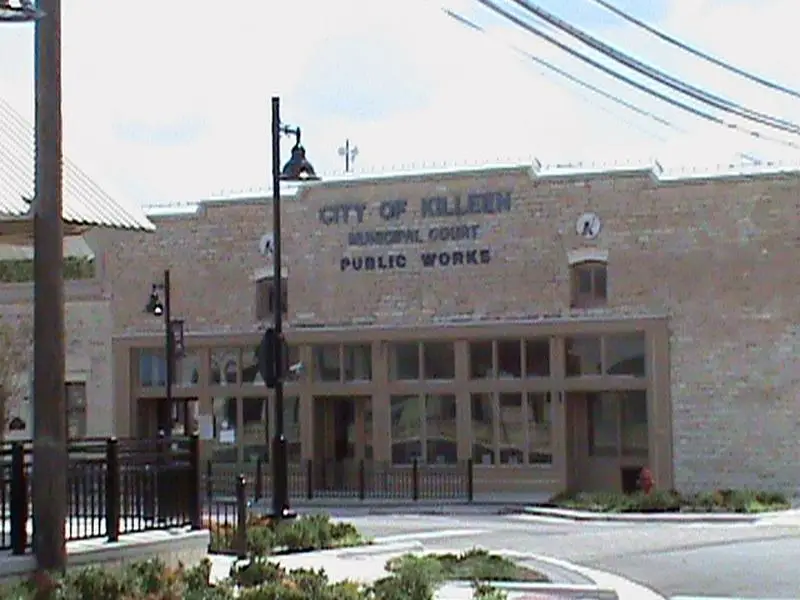
/10
Population: 153,708
Median Age: 29.7
Married households: 10.0%
Households with kids: 37.9%
More on Killeen: Data | Crime | Cost Of Living | Real Estate


Killeen has a few nice areas, but there are a lot of dangerous areas. There are a lot of options as far as places to eat. It is heavily military with Ft. Hood just next door. The mall is decent for this area, meaning it has more open stores than closed ones. Traffic from Ft. Hood can be quite bad at times.
There is a reason the local hospital is referred to as Murderplex. There are some really rough areas, especially at night.

/10
Population: 958,202
Median Age: 34.2
Married households: 14.0%
Households with kids: 25.0%
More on Austin: Data | Crime | Cost Of Living | Real Estate


Here is a great place to live.
Texas state capitol building is awesome!!
/10
Population: 254,962
Median Age: 32.4
Married households: 9.0%
Households with kids: 37.1%
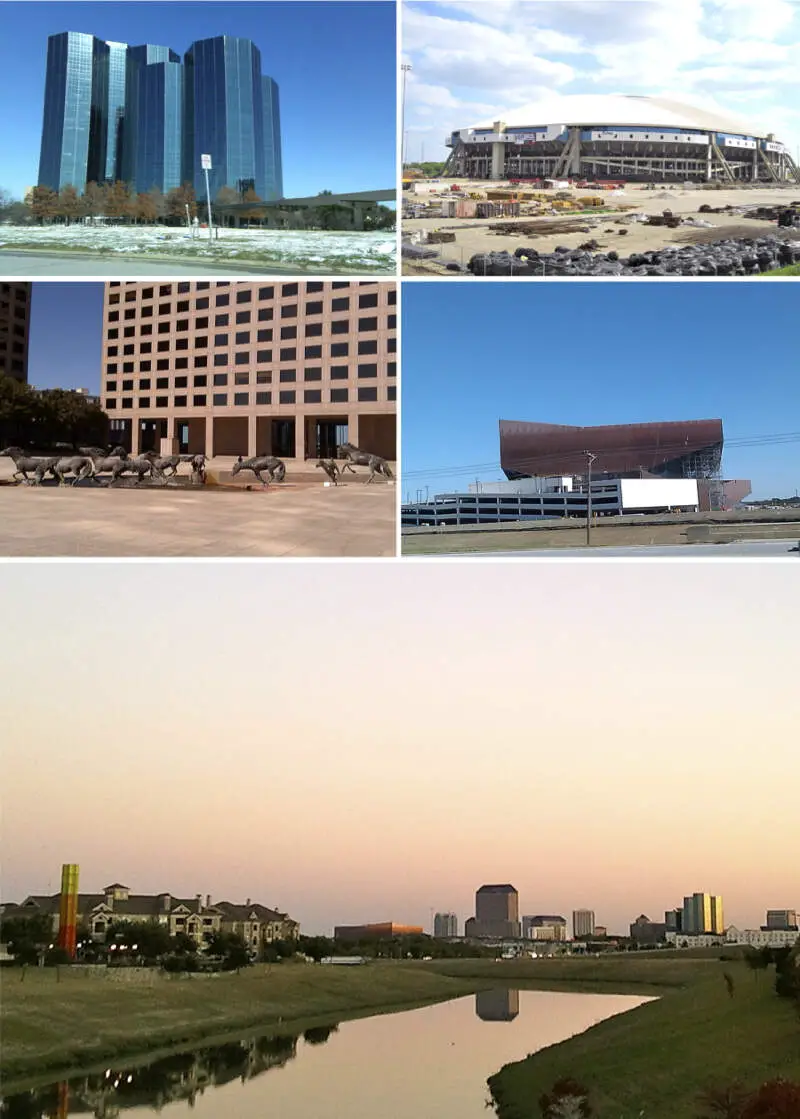
More on Irving: Data | Crime | Cost Of Living | Real Estate
/10
Population: 118,063
Median Age: 34.5
Married households: 15.0%
Households with kids: 29.9%
More on Richardson: Data | Crime | Cost Of Living | Real Estate
Methodology: How do you determine which city is best for singles in Texas anyways?
To give you the places in Texas which are best for singles to find one another, we used Saturday Night Science to look at a handful of metrics. Of course, we want to measure the type of people who live in each city and make some assumptions about what single people like.
So we researched the internet for a database that contains all that information.
We threw a lot of criteria at this one to get the best, most complete results possible. Using the 2018-2022 American Community Survey Census data produced for the state of Texas, we looked at every single city in the state. We paid particular attention to:
- Population density
- % of population that’s male vs. female (closer to a 50-50 ratio is better)
- % of households with kids
- Median age
- Number of unmarried people in each city
We then gave each city a “Singles Score.”
The higher the score, the better the city is for singles to find one another. We also limited our results to cities with over 10,000 people. For Texas, that meant a total of 226 cities.
We updated this article for 2024. This is our tenth time ranking the best cities for singles in Texas.
Read on to see why Dallas is the talk of the town while Robinson is probably a bit on the bland side.
Summary: The Best Cities for Singles in Texas for 2024
If you’re looking for a breakdown of cities in Texas ranked by criteria that most agree make a place a great spot for finding a single person (and potentially love), this is an accurate list.
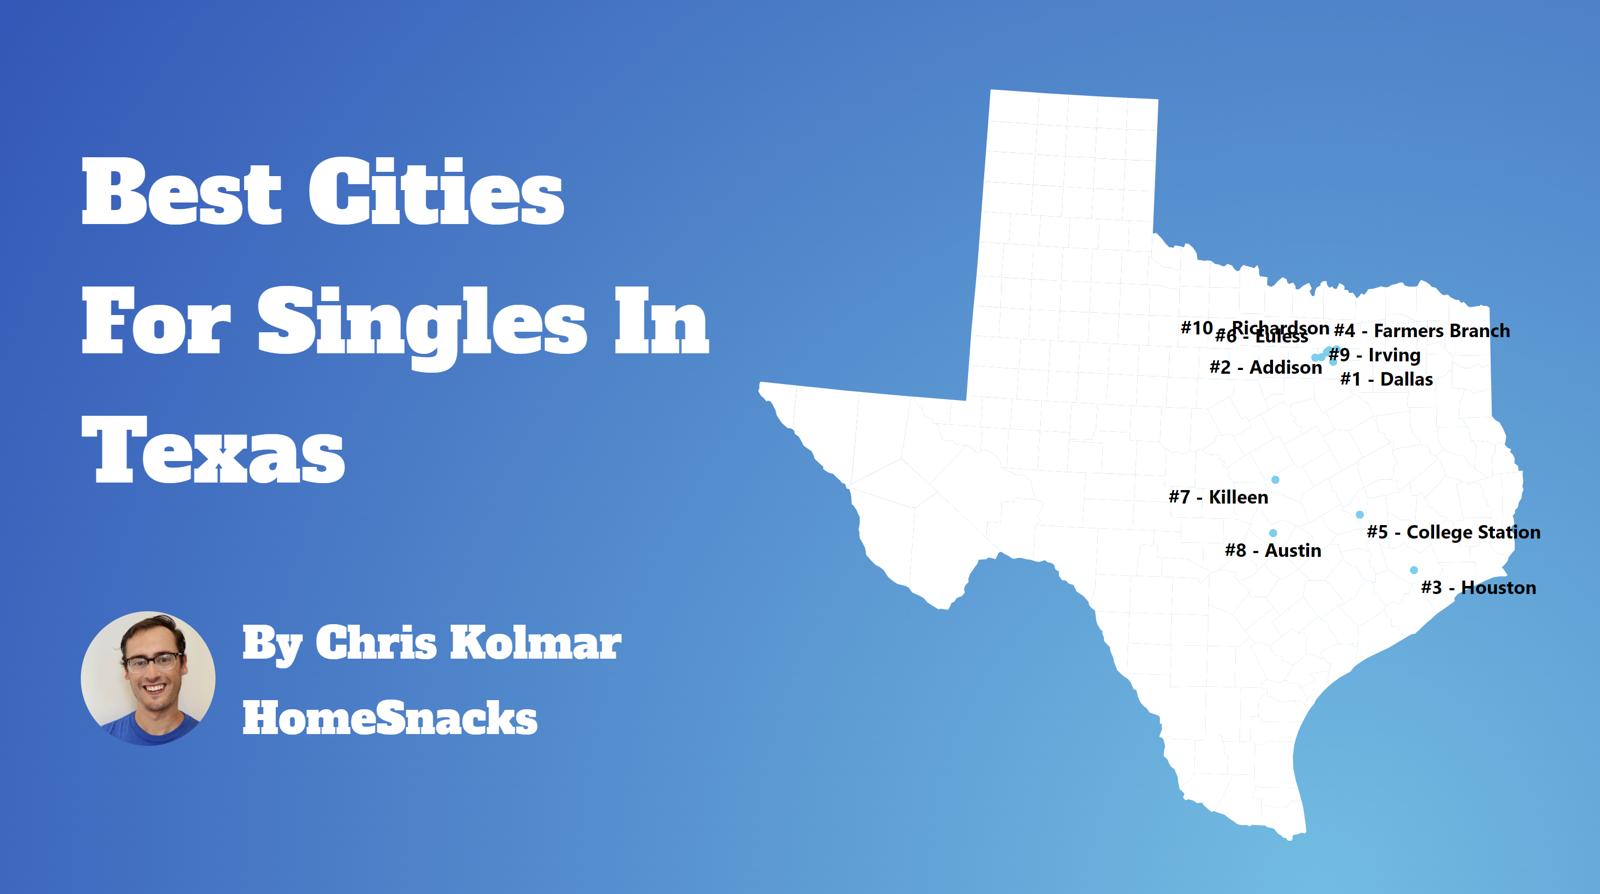
The best cities for singles in Texas are Dallas, Addison, Houston, Farmers Branch, College Station, Euless, Killeen, Austin, Irving, and Richardson.
Here’s a look at the most boring cities in Texas according to the data:
- Robinson
- Celina
- Lockhart
For more Texas reading, check out:
Best Cities For Singles In Texas
| Rank | City | Population | Median Age | % Married Households | % Households /w Kids |
|---|---|---|---|---|---|
| 1 | Dallas, TX | 1,300,642 | 33.1 | 14.0% | 28.9% |
| 2 | Addison, TX | 17,026 | 34.0 | 10.0% | 14.3% |
| 3 | Houston, TX | 2,296,253 | 33.9 | 13.0% | 31.0% |
| 4 | Farmers Branch, TX | 35,985 | 34.1 | 13.0% | 26.9% |
| 5 | College Station, TX | 120,451 | 22.9 | 13.0% | 24.8% |
| 6 | Euless, TX | 60,360 | 34.3 | 15.0% | 31.9% |
| 7 | Killeen, TX | 153,708 | 29.7 | 10.0% | 37.9% |
| 8 | Austin, TX | 958,202 | 34.2 | 14.0% | 25.0% |
| 9 | Irving, TX | 254,962 | 32.4 | 9.0% | 37.1% |
| 10 | Richardson, TX | 118,063 | 34.5 | 15.0% | 29.9% |
| 11 | Bryan, TX | 84,820 | 30.8 | 21.0% | 30.4% |
| 12 | Arlington, TX | 393,469 | 33.1 | 16.0% | 35.5% |
| 13 | Denton, TX | 142,262 | 30.4 | 16.0% | 27.2% |
| 14 | Carrollton, TX | 132,284 | 38.6 | 14.0% | 29.9% |
| 15 | Copperas Cove, TX | 36,436 | 31.7 | 12.0% | 37.1% |
| 16 | San Antonio, TX | 1,445,662 | 34.1 | 21.0% | 32.1% |
| 17 | Garland, TX | 244,026 | 34.4 | 15.0% | 38.9% |
| 18 | Richmond, TX | 11,931 | 33.8 | 16.0% | 25.1% |
| 19 | The Colony, TX | 44,323 | 37.2 | 19.0% | 29.3% |
| 20 | Pasadena, TX | 150,620 | 32.6 | 18.0% | 40.9% |
| 21 | Seabrook, TX | 13,558 | 34.8 | 20.0% | 30.9% |
| 22 | Webster, TX | 12,297 | 37.5 | 14.0% | 16.3% |
| 23 | Clute, TX | 10,670 | 30.2 | 19.0% | 33.4% |
| 24 | Plano, TX | 284,948 | 38.9 | 13.0% | 33.9% |
| 25 | Stafford, TX | 17,240 | 32.6 | 14.0% | 33.7% |
| 26 | San Marcos, TX | 67,143 | 25.2 | 18.0% | 17.5% |
| 27 | El Paso, TX | 677,181 | 33.7 | 18.0% | 36.8% |
| 28 | Lubbock, TX | 258,190 | 30.0 | 26.0% | 28.9% |
| 29 | Fort Worth, TX | 924,663 | 33.2 | 18.0% | 36.7% |
| 30 | Waco, TX | 140,545 | 28.8 | 20.0% | 30.3% |
| 31 | Bedford, TX | 49,455 | 38.3 | 21.0% | 26.6% |
| 32 | Lewisville, TX | 125,028 | 34.2 | 15.0% | 34.1% |
| 33 | South Houston, TX | 16,169 | 28.3 | 17.0% | 49.5% |
| 34 | Grand Prairie, TX | 197,279 | 33.7 | 17.0% | 39.1% |
| 35 | Balch Springs, TX | 27,322 | 31.4 | 19.0% | 45.1% |
| 36 | Mcallen, TX | 142,722 | 32.9 | 21.0% | 40.8% |
| 37 | Conroe, TX | 92,475 | 33.5 | 20.0% | 33.6% |
| 38 | Harker Heights, TX | 33,036 | 34.5 | 10.0% | 45.5% |
| 39 | Alton, TX | 18,493 | 25.9 | 19.0% | 57.3% |
| 40 | Baytown, TX | 84,449 | 33.9 | 19.0% | 38.0% |
| 41 | Beeville, TX | 13,637 | 28.5 | 29.0% | 37.5% |
| 42 | Laredo, TX | 255,293 | 29.3 | 22.0% | 50.6% |
| 43 | Converse, TX | 28,052 | 33.8 | 21.0% | 40.9% |
| 44 | Hurst, TX | 40,053 | 38.1 | 21.0% | 33.4% |
| 45 | Mesquite, TX | 149,439 | 33.4 | 19.0% | 39.6% |
| 46 | Hereford, TX | 14,943 | 29.6 | 28.0% | 43.4% |
| 47 | Alamo, TX | 19,811 | 30.1 | 20.0% | 42.1% |
| 48 | Round Rock, TX | 120,465 | 35.9 | 18.0% | 39.2% |
| 49 | Galena Park, TX | 10,641 | 28.0 | 11.0% | 50.3% |
| 50 | Edinburg, TX | 100,964 | 29.9 | 22.0% | 39.3% |
| 51 | San Angelo, TX | 99,422 | 34.7 | 29.0% | 31.1% |
| 52 | Huntsville, TX | 46,202 | 31.0 | 14.0% | 21.8% |
| 53 | Coppell, TX | 42,513 | 39.6 | 15.0% | 44.5% |
| 54 | Cedar Park, TX | 76,344 | 37.6 | 17.0% | 40.3% |
| 55 | Pharr, TX | 79,434 | 29.4 | 17.0% | 50.3% |
| 56 | Bellmead, TX | 10,480 | 34.8 | 19.0% | 40.0% |
| 57 | Mckinney, TX | 196,160 | 36.9 | 17.0% | 43.8% |
| 58 | Mount Pleasant, TX | 16,065 | 30.4 | 20.0% | 41.4% |
| 59 | Canyon, TX | 15,089 | 28.8 | 26.0% | 36.1% |
| 60 | Stephenville, TX | 21,020 | 25.5 | 22.0% | 28.1% |
| 61 | Odessa, TX | 113,353 | 30.7 | 27.0% | 40.2% |
| 62 | Bellaire, TX | 17,163 | 44.3 | 20.0% | 39.2% |
| 63 | Allen, TX | 105,444 | 37.8 | 17.0% | 43.1% |
| 64 | Live Oak, TX | 15,726 | 33.7 | 17.0% | 38.4% |
| 65 | Nacogdoches, TX | 32,148 | 24.4 | 21.0% | 29.2% |
| 66 | Sugar Land, TX | 110,077 | 42.5 | 15.0% | 36.6% |
| 67 | Palmview, TX | 15,245 | 40.8 | 15.0% | 36.6% |
| 68 | Corpus Christi, TX | 317,804 | 35.7 | 29.0% | 33.3% |
| 69 | Wichita Falls, TX | 102,482 | 32.8 | 21.0% | 28.9% |
| 70 | Beaumont, TX | 114,573 | 35.5 | 24.0% | 30.5% |
| 71 | Mission, TX | 85,755 | 33.7 | 20.0% | 43.6% |
| 72 | Kingsville, TX | 25,265 | 27.4 | 26.0% | 33.1% |
| 73 | Amarillo, TX | 200,360 | 34.4 | 28.0% | 33.7% |
| 74 | Rosenberg, TX | 38,722 | 31.2 | 18.0% | 38.0% |
| 75 | Harlingen, TX | 71,497 | 33.2 | 24.0% | 36.1% |
| 76 | Hidalgo, TX | 14,075 | 28.8 | 15.0% | 57.8% |
| 77 | Grapevine, TX | 50,763 | 39.8 | 17.0% | 26.9% |
| 78 | Eagle Pass, TX | 28,166 | 29.7 | 21.0% | 47.0% |
| 79 | Watauga, TX | 23,509 | 35.8 | 23.0% | 33.6% |
| 80 | Roma, TX | 11,531 | 29.7 | 19.0% | 42.1% |
| 81 | Lake Jackson, TX | 27,954 | 33.6 | 27.0% | 33.7% |
| 82 | Rowlett, TX | 63,291 | 38.6 | 26.0% | 36.9% |
| 83 | Murphy, TX | 20,880 | 39.3 | 18.0% | 61.6% |
| 84 | Abilene, TX | 126,356 | 32.2 | 25.0% | 32.0% |
| 85 | Belton, TX | 23,137 | 28.7 | 19.0% | 31.8% |
| 86 | North Richland Hills, TX | 70,114 | 38.7 | 23.0% | 31.5% |
| 87 | San Benito, TX | 24,766 | 31.5 | 28.0% | 38.4% |
| 88 | San Juan, TX | 35,463 | 29.5 | 22.0% | 51.7% |
| 89 | Duncanville, TX | 40,288 | 36.9 | 21.0% | 34.1% |
| 90 | Deer Park, TX | 34,046 | 36.8 | 33.0% | 38.4% |
| 91 | Greenville, TX | 28,923 | 35.3 | 24.0% | 28.9% |
| 92 | Galveston, TX | 53,265 | 39.4 | 19.0% | 19.3% |
| 93 | Humble, TX | 16,563 | 33.5 | 19.0% | 33.6% |
| 94 | Dumas, TX | 14,404 | 29.2 | 22.0% | 45.6% |
| 95 | Forest Hill, TX | 13,810 | 31.7 | 16.0% | 48.5% |
| 96 | Frisco, TX | 202,075 | 37.8 | 12.0% | 48.3% |
| 97 | Uvalde, TX | 15,342 | 31.9 | 28.0% | 45.4% |
| 98 | Selma, TX | 11,067 | 32.6 | 19.0% | 46.7% |
| 99 | White Settlement, TX | 18,106 | 35.8 | 20.0% | 35.9% |
| 100 | Manor, TX | 15,341 | 30.7 | 19.0% | 51.8% |

