Some of you might be asking yourself, at this very moment, is Minnesota a good place?
The answer is unequivocally yes… if you know where to locate the best counties to live in Minnesota.
Lucky for you, we’re here to help you identify the best counties to live in the North Star State based on the most recently available data from the Census. And this isn’t our first rodeo — we’ve been using Saturday Night Science to rank places for years.
The question becomes if you wanted to relocate to the best part of Minnesota, where would you go? To answer that, we looked at crime, cost of living, and demographic data for all 87 counties in the state.
Table Of Contents: Top Ten | Methodology | Table | FAQs | Summary
The 10 Best Counties To Live In Minnesota For 2026
Carver County is the county to be when it comes to living the good life in Minnesota. And you should avoid Mahnomen County if you can — at least according to the data.
Now you know exactly where to move in Minnesota. Keep on reading for more about the top ten and a detailed methodology.
Or, check out the best places to live in Minnesota and the cheapest places to live in Minnesota.
Table Of Contents: Top Ten | Methodology | Summary | Table
The Best Counties To Live In Minnesota For 2026
1. Carver County

Biggest Place: Chaska
Population: 110,041
Median Income: $125,946 (best)
Median Home Price: $483,655 (best)
Unemployment Rate: 3.1% (28th best)
More on Carver County: Data
2. Washington County
Biggest Place: Woodbury
Population: 276,238
Median Income: $115,345 (3rd best)
Median Home Price: $440,692 (3rd best)
Unemployment Rate: 3.4% (36th best)
More on Washington County: Data
3. Scott County
Biggest Place: Shakopee
Population: 154,557
Median Income: $119,314 (2nd best)
Median Home Price: $441,654 (2nd best)
Unemployment Rate: 3.5% (38th best)
More on Scott County: Data
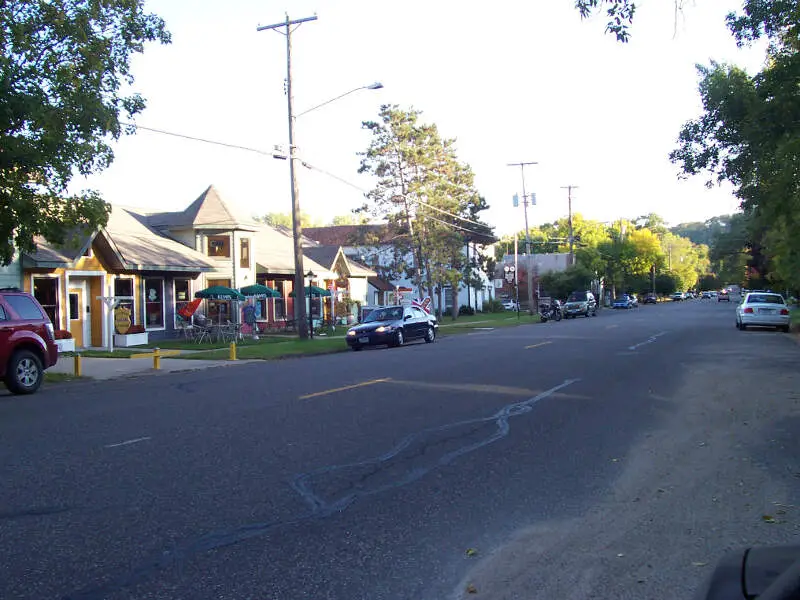
4. Wabasha County
Biggest Place: Lake City
Population: 21,565
Median Income: $82,007 (17th best)
Median Home Price: $307,048 (28th best)
Unemployment Rate: 2.2% (9th best)
More on Wabasha County: Data
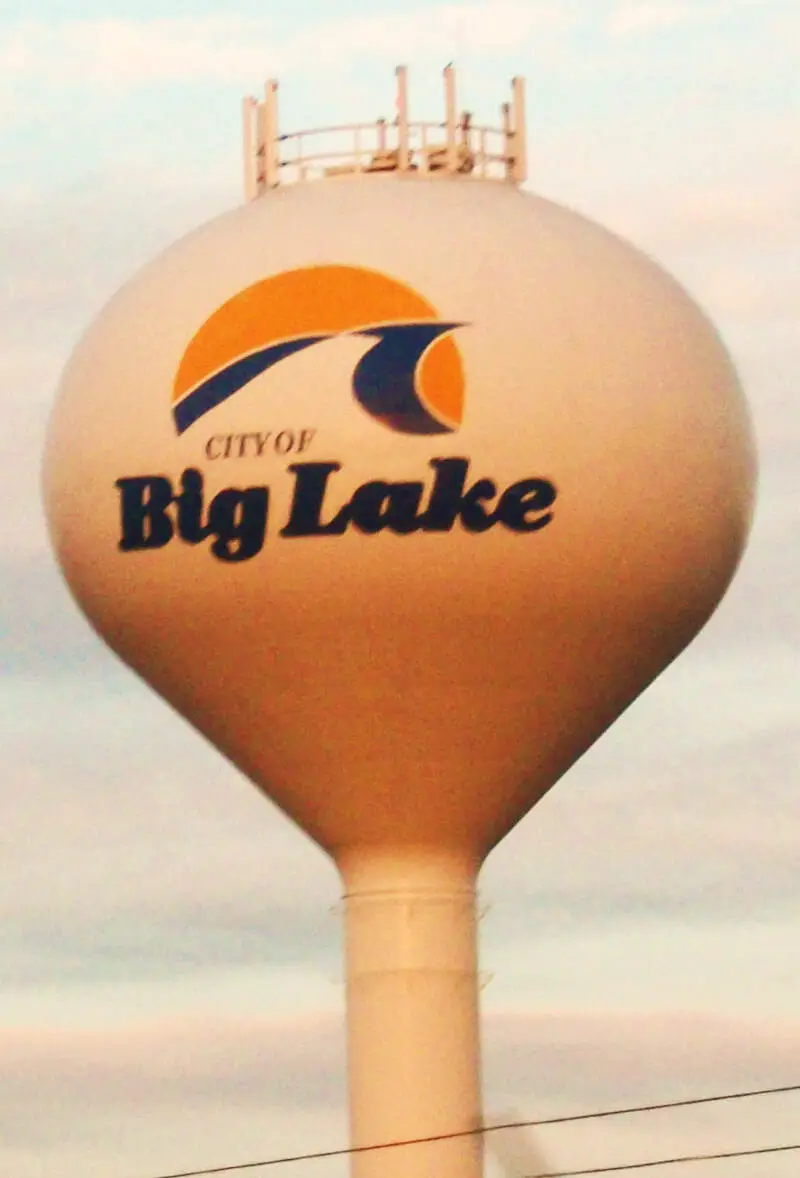
5. Wright County
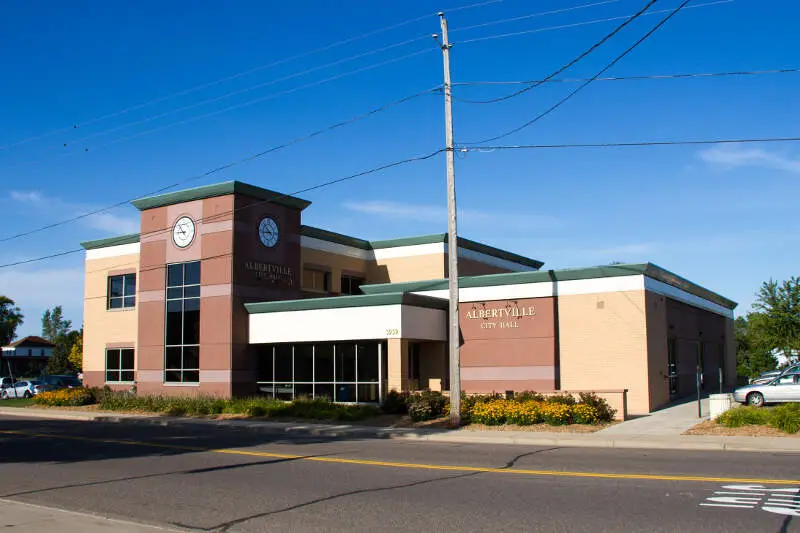
Biggest Place: Otsego
Population: 148,269
Median Income: $107,209 (4th best)
Median Home Price: $388,429 (6th best)
Unemployment Rate: 2.7% (2best)
More on Wright County: Data
6. Sherburne County
Biggest Place: St. Cloud
Population: 100,560
Median Income: $105,466 (6th best)
Median Home Price: $383,718 (8th best)
Unemployment Rate: 3.0% (27th best)
More on Sherburne County: Data
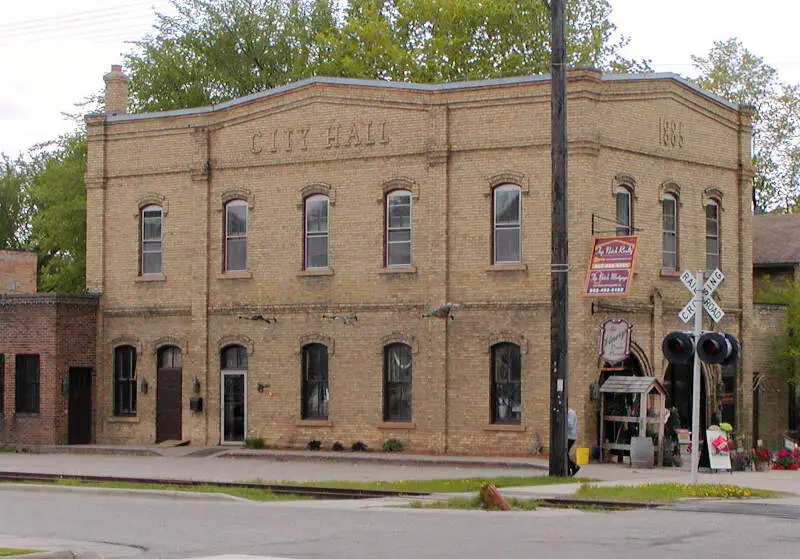
7. Pope County
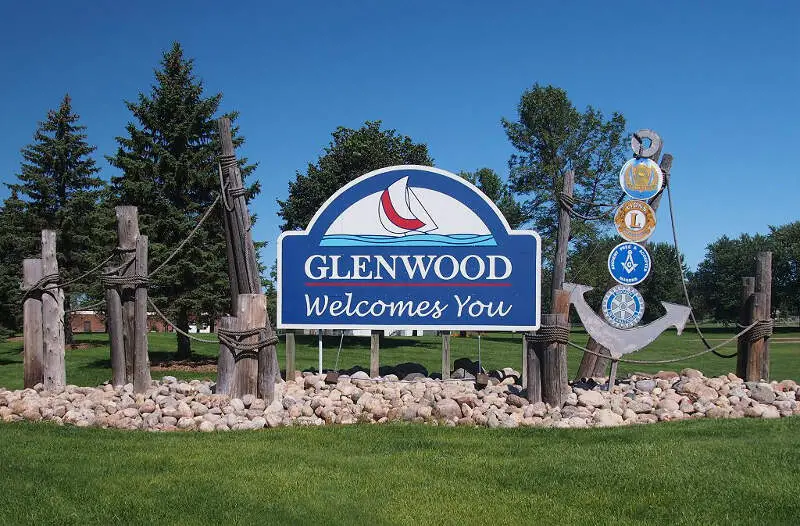
Biggest Place: Glenwood
Population: 11,418
Median Income: $76,220 (33rd best)
Median Home Price: $328,244 (20th best)
Unemployment Rate: 1.3% (2nd best)
More on Pope County: Data
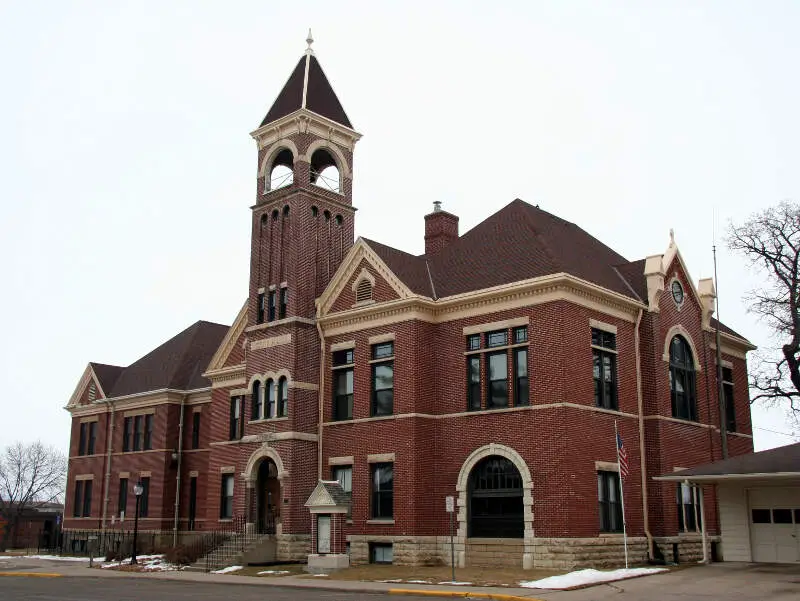
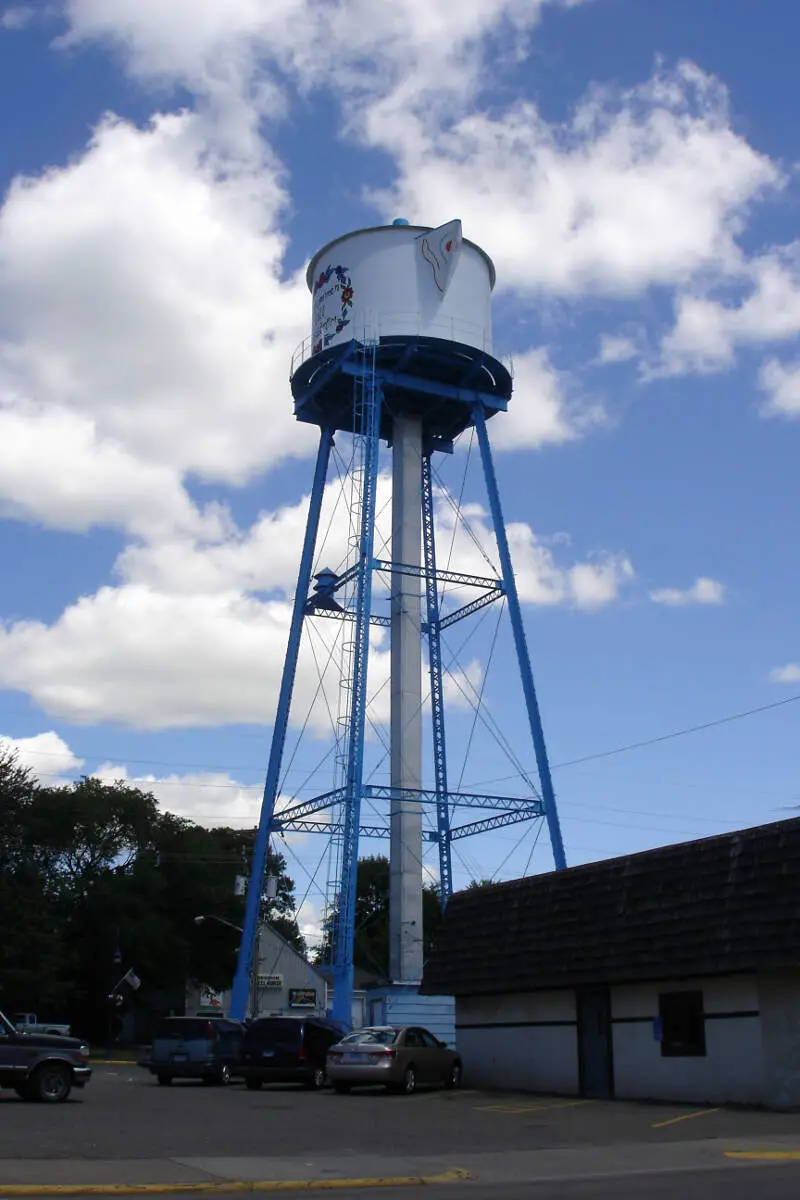
8. Lake Of The Woods County
Biggest Place: Baudette
Population: 3,821
Median Income: $77,546 (26th best)
Median Home Price: $227,172 (58th best)
Unemployment Rate: 1.5% (3rd best)
More on Lake Of The Woods County: Data
9. Chisago County
Biggest Place: North Branch
Population: 57,991
Median Income: $99,400 (8th best)
Median Home Price: $378,343 (9th best)
Unemployment Rate: 4.1% (52nd best)
More on Chisago County: Data
10. Dakota County

Biggest Place: Lakeville
Population: 445,771
Median Income: $106,318 (5th best)
Median Home Price: $395,251 (5th best)
Unemployment Rate: 3.6% (44th best)
More on Dakota County: Data
Methodology: How do you determine which Minnesota county is the best?
To give you the best county in Minnesota, we have to look at a handful of metrics that signal the quality of a place. To do that, we made assumptions about what’s in a “best county” and what isn’t. For reference, we are trying to make the kind of argument you’d make at a bar using facts, Saturday Night Science.
With that in mind, we went to two of the best data sources on the internet. Namely, the American Community Survey data and FBI Crime data for the most recent period.
We paid particular attention to:
- Violent Crime Rates
- Property Crime Rates
- Median Home Values
- Median Income
- Unemployment Rates
- Adult Education Levels
- Health Insurance Coverage
- Poverty Rates
We then ranked each county in Minnesota across each of the criteria from one to 87, with one being the best.
Taking the average rank across all criteria, we created a quality of life score with the county posting the lowest overall score being the “Best County To Live In Minnesota.”
The result is some of the safest, quietest, and best counties to raise a family in the North Star State.
We updated this article for 2026. This report is our eleventh time ranking the best counties to live in Minnesota.
Read on to see why Carver County is the best county, while Mahnomen County is probably in contention for being the worst county in Minnesota.
Summary: The Best Counties In Minnesota To Call Home For 2026
Living in Minnesota can vary from one part of the state to the next — who woulda thought?
The best counties in Minnesota are Carver County, Washington County, Scott County, Wabasha County, Wright County, Sherburne County, Pope County, Lake of the Woods County, Chisago County, and Dakota County.
But now you know the outstanding parts and the parts to avoid, and that’s why you came here to learn at the end of the day.
You are welcome.
Here’s a look at the worst counties in Minnesota according to the data:
- Mahnomen County
- Watonwan County
- Clearwater County
For more Minnesota reading, check out:
- Richest Cities In Minnesota
- Best Places To Retire In Minnesota
- Cheapest Places To Live In Minnesota
- Best Places To Buy A House In Minnesota
Detailed List Of The Best Counties In Minnesota
| Rank | County | Population | Median Income | Median Home Price |
|---|---|---|---|---|
| 1 | Carver County | 110,041 | $125,946 | $483,655 |
| 2 | Washington County | 276,238 | $115,345 | $440,692 |
| 3 | Scott County | 154,557 | $119,314 | $441,654 |
| 4 | Wabasha County | 21,565 | $82,007 | $307,048 |
| 5 | Wright County | 148,269 | $107,209 | $388,429 |
| 6 | Sherburne County | 100,560 | $105,466 | $383,718 |
| 7 | Pope County | 11,418 | $76,220 | $328,244 |
| 8 | Lake Of The Woods County | 3,821 | $77,546 | $227,172 |
| 9 | Chisago County | 57,991 | $99,400 | $378,343 |
| 10 | Dakota County | 445,771 | $106,318 | $395,251 |
| 11 | Houston County | 18,653 | $79,825 | $317,202 |
| 12 | Nicollet County | 34,411 | $79,756 | $310,840 |
| 13 | Douglas County | 39,575 | $79,043 | $337,107 |
| 14 | Steele County | 37,439 | $84,196 | $292,373 |
| 15 | Anoka County | 370,349 | $101,869 | $367,949 |
| 16 | Dodge County | 21,045 | $95,739 | $322,430 |
| 17 | Olmsted County | 164,498 | $95,406 | $347,632 |
| 18 | Red Lake County | 3,915 | $77,188 | $211,300 |
| 19 | Jackson County | 9,933 | $75,743 | $221,299 |
| 20 | Le Sueur County | 29,113 | $94,968 | $351,272 |
| 21 | Waseca County | 18,885 | $76,261 | $249,600 |
| 22 | Cook County | 5,635 | $72,638 | $423,365 |
| 23 | Isanti County | 42,596 | $87,440 | $334,413 |
| 24 | Lac Qui Parle County | 6,682 | $74,432 | $165,912 |
| 25 | Hennepin County | 1,269,496 | $97,653 | $387,852 |
| 26 | Lake County | 10,879 | $75,541 | $272,294 |
| 27 | Sibley County | 15,005 | $77,634 | $282,130 |
| 28 | Clay County | 66,059 | $81,172 | $294,252 |
| 29 | Fillmore County | 21,414 | $77,512 | $280,107 |
| 30 | Mcleod County | 36,798 | $80,084 | $291,893 |
| 31 | Benton County | 41,593 | $74,410 | $303,855 |
| 32 | Yellow Medicine County | 9,451 | $74,000 | $169,365 |
| 33 | Goodhue County | 47,943 | $84,171 | $322,013 |
| 34 | Kittson County | 4,084 | $76,100 | $166,135 |
| 35 | Meeker County | 23,468 | $75,446 | $286,407 |
| 36 | Crow Wing County | 67,686 | $72,589 | $362,465 |
| 37 | Grant County | 6,127 | $73,917 | $229,858 |
| 38 | Pennington County | 13,791 | $77,325 | $190,508 |
| 39 | Rice County | 67,917 | $83,181 | $344,689 |
| 40 | Big Stone County | 5,127 | $70,400 | $193,279 |
| 41 | Murray County | 8,097 | $74,033 | $243,555 |
| 42 | Rock County | 9,621 | $71,295 | $265,355 |
| 43 | Brown County | 25,800 | $69,378 | $241,190 |
| 44 | Otter Tail County | 60,475 | $72,255 | $323,150 |
| 45 | Roseau County | 15,302 | $74,474 | $218,852 |
| 46 | Carlton County | 36,518 | $80,573 | $292,855 |
| 47 | Winona County | 49,779 | $70,744 | $273,187 |
| 48 | Marshall County | 8,909 | $72,543 | $207,227 |
| 49 | Stevens County | 9,739 | $75,733 | $209,674 |
| 50 | Hubbard County | 21,831 | $71,995 | $312,005 |
| 51 | Stearns County | 160,865 | $77,066 | $312,501 |
| 52 | Morrison County | 34,249 | $69,446 | $303,389 |
| 53 | Mille Lacs County | 27,125 | $72,729 | $306,035 |
| 54 | Kandiyohi County | 44,079 | $76,592 | $275,544 |
| 55 | Blue Earth County | 69,871 | $74,477 | $300,116 |
| 56 | Renville County | 14,558 | $70,625 | $189,696 |
| 57 | Lyon County | 25,503 | $75,303 | $214,037 |
| 58 | Becker County | 35,343 | $71,388 | $347,851 |
| 59 | Martin County | 19,780 | $59,507 | $214,070 |
| 60 | Ramsey County | 542,945 | $81,568 | $336,493 |
| 61 | Lincoln County | 5,603 | $69,694 | $198,582 |
| 62 | Kanabec County | 16,390 | $71,460 | $265,306 |
| 63 | Wilkin County | 6,371 | $71,410 | $216,759 |
| 64 | Polk County | 30,705 | $73,107 | $244,862 |
| 65 | Traverse County | 3,243 | $62,989 | $147,483 |
| 66 | St. Louis County | 200,123 | $70,069 | $233,077 |
| 67 | Pipestone County | 9,284 | $69,628 | $193,589 |
| 68 | Itasca County | 45,275 | $68,603 | $241,941 |
| 69 | Cass County | 30,992 | $68,874 | $334,054 |
| 70 | Cottonwood County | 11,458 | $72,941 | $160,479 |
| 71 | Aitkin County | 16,056 | $60,833 | $268,115 |
| 72 | Mower County | 40,343 | $73,074 | $199,052 |
| 73 | Pine County | 29,640 | $71,146 | $253,269 |
| 74 | Redwood County | 15,350 | $67,866 | $178,762 |
| 75 | Faribault County | 13,914 | $66,815 | $158,994 |
| 76 | Norman County | 6,367 | $72,260 | $172,481 |
| 77 | Todd County | 25,575 | $67,662 | $259,272 |
| 78 | Swift County | 9,748 | $60,412 | $188,707 |
| 79 | Koochiching County | 11,833 | $66,940 | $154,275 |
| 80 | Freeborn County | 30,623 | $71,023 | $191,496 |
| 81 | Chippewa County | 12,377 | $71,458 | $220,852 |
| 82 | Beltrami County | 46,512 | $68,975 | $261,029 |
| 83 | Wadena County | 14,256 | $61,467 | $223,828 |
| 84 | Nobles County | 22,041 | $66,101 | $235,209 |
| 85 | Clearwater County | 8,616 | $64,475 | $246,480 |
| 86 | Watonwan County | 11,205 | $71,699 | $171,371 |
| 87 | Mahnomen County | 5,358 | $59,441 | $179,667 |


