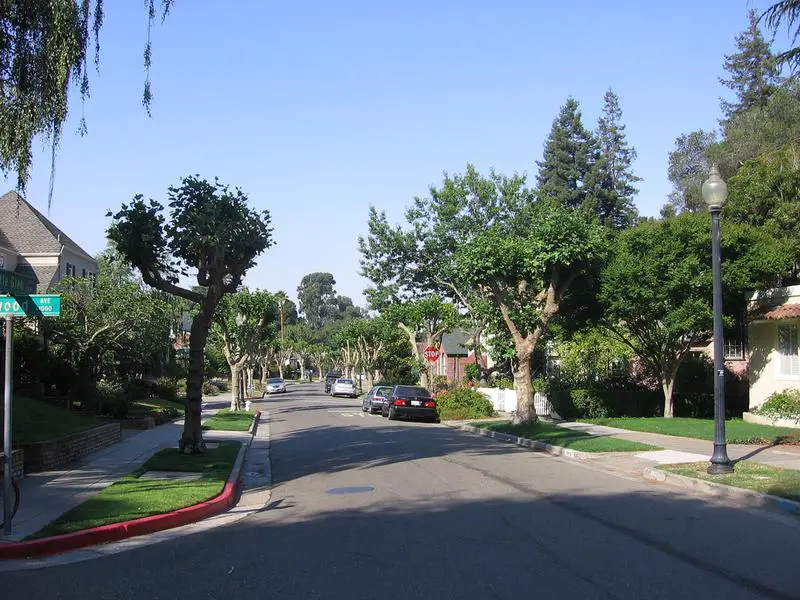
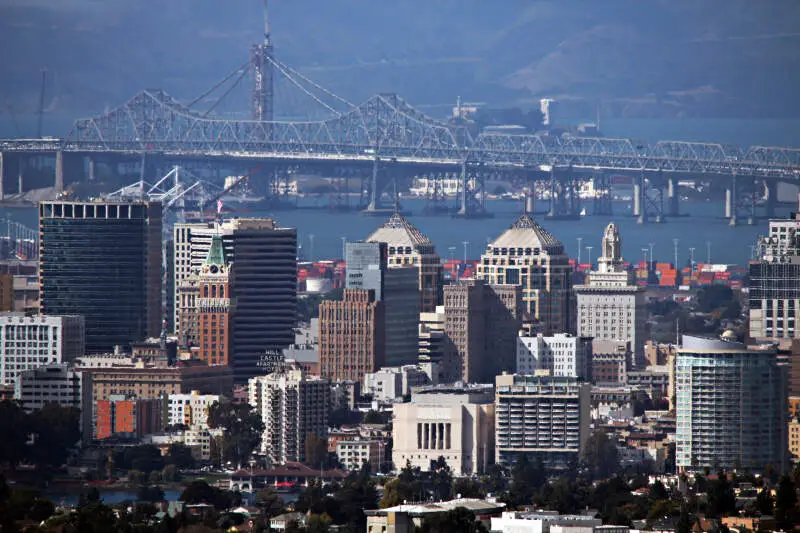
Oakland has seen a huge influx of people over the last 10 years even as California has started to see an outflow. We don’t know if this increase is because it’s one of the top 100 cities in America for singles or because people are crossing the Bay Bridge to flee San Francisco’s high cost of living, but what we do know is that Oakland has some pretty cool neighborhoods. And if you want to know where those neighborhoods are located, you should take a look below at HomeSnacks’ list of the top ten best neighborhoods in Oaktown for 2024.
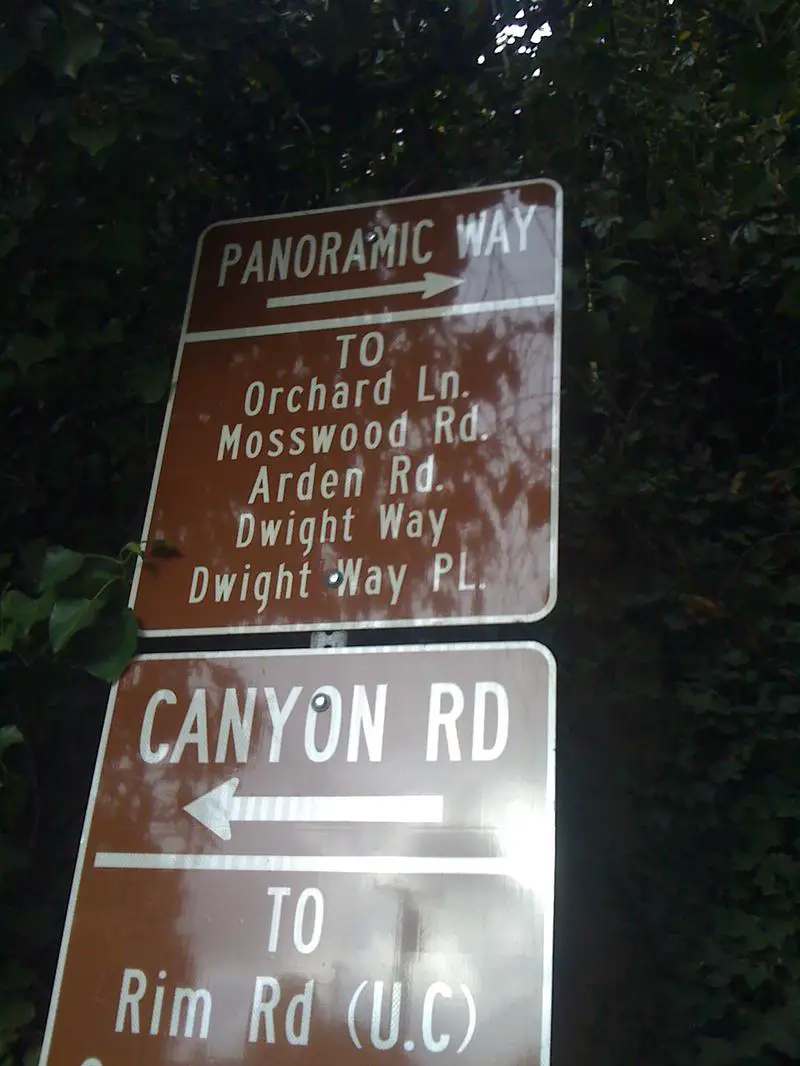
It’s not that Oakland doesn’t have its fair share of problems–most cities with 422,437 residents generally do, but Oakland is working hard to find solutions that are best for everyone. Oakland is afterall one of the most diverse cities in California. However, where Oakland used to be in the headlines for high crime, the city is now being used in conversations that include words like progress and renewal. And, people, this sense of rebirth is starting in Oakland’s best neighborhoods. For example, if you’re looking for a quirky bohemian enclave, the Fairview Park neighborhood has eclectic coffee shops and a bunch of craft breweries. The Panoramic Hill neighborhood has everything Oakland, but it comes with a pretty expensive price tag. But, if you want the best deal, Piedmont is the most affordable in terms of median income level to home price ratio.
And because HomeSnacks doesn’t want you to live a life with regret, we think that you should definitely make one of Oakland’s best neighborhoods your first Northern California choice. To do this, you’re going to need to keep reading to see your top ten choices.
Table Of Contents: Top Ten | Methodology | Summary | Table
In our quest to determine Oakland’s best neighborhoods, we also ranked the city’s hoods based on safety, unemployment rates, affordability, and amenities and gave each a SnackAbility score. Folks, Oakland’s top ten neighborhoods scored a 9.5/10 and better. So, you know these are some pretty amazing places.
But, what is the best neighborhood in Oakland? According to the latest data that would be Fairview Park.
To see where the rest of Oakland’s neighborhoods ranked take a look below. And if you don’t find your favorite there, head to the bottom.
For more California reading, check out:
- Best Places To Live In California
- Cheapest Places To Live In California
- Most Dangerous Cities In California
The 10 Best Neighborhoods To Live In Oakland
Population: 3,992
Median Home Value: $1,188,067 (Sixth best)
Median Income: $132,915 (22nd best)
More on Fairview Park: Data | Real Estate
Population: 10,992
Median Home Value: $1,604,023 (Second best)
Median Income: $204,144 (Fourth best)
More on Piedmont: Data | Real Estate
Population: 4,335
Median Home Value: $1,341,575 (Fourth best)
Median Income: $214,386 (Third best)
More on Montclair: Data | Real Estate
Population: 1,712
Median Home Value: $1,027,200 (18th best)
Median Income: $189,943 (11th best)
More on Forestland: Data | Real Estate

Population: 1,210
Median Home Value: $1,633,100 (best)
Median Income: $214,500 (Second best)
More on Panoramic Hill: Data | Real Estate
Population: 3,894
Median Home Value: $1,095,433 (Ninth best)
Median Income: $198,252 (Sixth best)
More on Merriwood: Data | Real Estate
Population: 8,157
Median Home Value: $870,700 (30th best)
Median Income: $99,605 (37th best)
More on Cleveland Heights: Data | Real Estate

Population: 3,628
Median Home Value: $1,044,300 (16th best)
Median Income: $194,731 (Ninth best)
More on Trestle Glen: Data | Real Estate
Population: 731
Median Home Value: $1,167,950 (Seventh best)
Median Income: $236,635 (best)
More on Hiller Highlands: Data | Real Estate
Population: 1,881
Median Home Value: $912,600 (28th best)
Median Income: $126,466 (26th best)
More on Lincoln Highlands: Data | Real Estate
Methodology: How We Determined The Best Oakland, CA Neighborhoods In 2024
To rank the best neighborhoods in Oakland, we had to determine what criteria define “best” and then apply Saturday Night Science to it.
Using FBI crime, Census, and extrapolated BLS data, we arrived at the following set of criteria:
- High incomes
- Low unemployment rates
- Low crime
- High home prices
- High population densities (A proxy for things to do)
We then ranked each neighborhood with scores from 1 to 128 in each category, where 1 was the best.
Next, we averaged the rankings for each neighborhood to create a best neighborhood index.
And finally, we crowned the neighborhood with the lowest best neighborhood index, the “Best City Neighborhood In Oakland.” We’re lookin’ at you, Fairview Park.
Read on below to learn more about what it’s like to live in the best places Oakland, California has to offer. Or skip to the end to see the list of all the neighborhoods in the city, from best to worst.
We updated this article for 2024. This report is our tenth time ranking the best neighborhoods to live in Oakland.
Summary: Putting A Bow On Our Analysis Of The Best Neighborhoods In Oakland
If you’re measuring the neighborhoods in Oakland where crime is low and everyone wants to live, this is an accurate list.
The best neighborhoods in Oakland are Fairview Park, Piedmont, Montclair, Forestland, Panoramic Hill, Merriwood, Cleveland Heights, Trestle Glen, Hiller Highlands, and Lincoln Highlands.
As mentioned earlier, the neighborhoods in Oakland aren’t all good. Columbia Gardens takes the title of the worst neighborhood to live in Oakland.
The worst neighborhoods in Oakland are Columbia Gardens, Acorn-Acorn Industrial, Melrose, Produce And Waterfront, and Coliseum Industrial.
We ranked the neighborhoods from best to worst in the chart below.
For more California reading, check out:
Best Neighborhoods To Live In Oakland For 2024 Detailed Data
| Rank | Neighborhood | Population | Home Value | Median Income |
|---|---|---|---|---|
| 1 | Fairview Park | 3,992 | $1,188,067 | $132,915 |
| 2 | Piedmont | 10,992 | $1,604,023 | $204,144 |
| 3 | Montclair | 4,335 | $1,341,575 | $214,386 |
| 4 | Forestland | 1,712 | $1,027,200 | $189,943 |
| 5 | Panoramic Hill | 1,210 | $1,633,100 | $214,500 |
| 6 | Merriwood | 3,894 | $1,095,433 | $198,252 |
| 7 | Cleveland Heights | 8,157 | $870,700 | $99,605 |
| 8 | Trestle Glen | 3,628 | $1,044,300 | $194,731 |
| 9 | Hiller Highlands | 731 | $1,167,950 | $236,635 |
| 10 | Lincoln Highlands | 1,881 | $912,600 | $126,466 |
| 11 | Glen Highlands | 1,287 | $1,079,750 | $177,448 |
| 12 | Lakeshore | 4,717 | $1,037,650 | $169,975 |
| 13 | Oakmore | 2,389 | $996,267 | $165,721 |
| 14 | Montclair Business | 178 | $1,089,800 | $198,750 |
| 15 | Claremont | 1,468 | $1,082,700 | $195,162 |
| 16 | Shepherd Canyon | 1,786 | $1,058,967 | $176,316 |
| 17 | Grand Lake | 5,165 | $632,433 | $103,276 |
| 18 | Upper Rockridge | 6,366 | $1,277,233 | $197,631 |
| 19 | Glenview | 5,707 | $966,357 | $129,882 |
| 20 | Redwood Heights | 9,316 | $779,743 | $117,292 |
| 21 | Lake Merritt | 879 | $768,150 | $115,330 |
| 22 | Shafter | 3,523 | $1,107,233 | $90,537 |
| 23 | Upper Dimond | 6,177 | $842,340 | $116,945 |
| 24 | Woodminster | 1,620 | $962,100 | $187,347 |
| 25 | Piedmont Pines | 3,198 | $1,059,900 | $183,535 |
| 26 | Piedmont Avenue | 7,021 | $736,086 | $89,932 |
| 27 | Mountain View Cemetery | 975 | $995,900 | $146,319 |
| 28 | Adams Point | 8,906 | $590,520 | $90,098 |
| 29 | Oak Tree | 5,164 | $953,033 | $46,722 |
| 30 | Allendale | 4,519 | $575,025 | $66,695 |
| 31 | Bushrod | 7,517 | $929,492 | $104,139 |
| 32 | Rockridge | 3,431 | $1,403,250 | $192,072 |
| 33 | Fairfax | 2,414 | $560,000 | $84,670 |
| 34 | Golden Gate | 2,316 | $735,450 | $97,038 |
| 35 | Gaskill | 2,243 | $819,333 | $95,553 |
| 36 | Paradise Park | 2,301 | $763,350 | $85,442 |
| 37 | Crestmont | 1,079 | $962,100 | $187,347 |
| 38 | Maxwell Park | 5,657 | $661,360 | $97,675 |
| 39 | Ivy Hill | 3,355 | $677,200 | $77,695 |
| 40 | Clinton | 7,705 | $579,371 | $63,619 |
| 41 | Jefferson | 4,142 | $528,650 | $67,829 |
| 42 | Bella Vista | 1,407 | $675,000 | $93,352 |
| 43 | Chabot Park | 4,616 | $698,000 | $111,840 |
| 44 | Santa Fe | 3,949 | $784,650 | $90,486 |
| 45 | Longfellow | 6,510 | $769,657 | $93,785 |
| 46 | Joaquin Miller Park | 862 | $1,059,900 | $175,972 |
| 47 | Sausal Creek | 2,135 | $585,825 | $72,278 |
| 48 | Temescal | 4,437 | $946,083 | $84,384 |
| 49 | Sobrante Park | 3,735 | $509,900 | $62,560 |
| 50 | Skyline-Hillcrest Estates | 921 | $667,400 | $123,204 |
| 51 | Harrington | 4,200 | $504,200 | $53,220 |
| 52 | Las Palmas | 3,120 | $473,700 | $78,751 |
| 53 | South Prescott | 285 | $625,000 | $163,932 |
| 54 | Waverly | 1,014 | $544,500 | $87,012 |
| 55 | Sequoyah | 4,128 | $561,700 | $120,190 |
| 56 | Millsmont | 5,861 | $625,800 | $72,298 |
| 57 | School | 2,080 | $553,233 | $67,199 |
| 58 | Oakland Ave-Harrison St | 5,921 | $600,450 | $72,751 |
| 59 | Pill Hill | 1,976 | $818,600 | $78,700 |
| 60 | Durant Manor | 2,578 | $582,800 | $84,924 |
| 61 | Patten | 2,619 | $584,400 | $55,978 |
| 62 | Fremont | 5,075 | $502,825 | $86,075 |
| 63 | Lakewide | 4,439 | $830,400 | $56,869 |
| 64 | Northgate | 1,790 | $875,000 | $73,556 |
| 65 | Caballo Hills | 3,096 | $474,800 | $129,463 |
| 66 | Merritt | 4,429 | $588,600 | $65,628 |
| 67 | Golf Links | 1,482 | $447,750 | $93,839 |
| 68 | Eastmont Hills | 2,724 | $635,350 | $110,692 |
| 69 | Prescott | 5,285 | $649,367 | $94,056 |
| 70 | San Pablo Gateway | 4,019 | $714,300 | $81,891 |
| 71 | Mosswood | 2,462 | $973,300 | $88,010 |
| 72 | Upper Laurel | 5,205 | $536,125 | $72,640 |
| 73 | Downtown | 3,128 | $737,667 | $83,100 |
| 74 | Tuxedo | 2,439 | $550,067 | $59,889 |
| 75 | Civic Center | 832 | $650,900 | $57,863 |
| 76 | Hoover-Foster | 4,859 | $733,500 | $71,651 |
| 77 | Dimond | 1,582 | $608,150 | $63,822 |
| 78 | Highland Terrace | 3,951 | $495,840 | $49,488 |
| 79 | Sheffield Village | 214 | $786,900 | $129,130 |
| 80 | Toler Heights | 2,316 | $564,133 | $73,715 |
| 81 | Bartlett | 2,051 | $467,760 | $56,034 |
| 82 | Foothill Square | 1,295 | $566,500 | $64,250 |
| 83 | Hegenberger | 1,788 | $390,967 | $52,715 |
| 84 | Brookfield Village | 3,656 | $422,367 | $64,445 |
| 85 | Castlemont | 3,668 | $376,320 | $42,222 |
| 86 | Upper Peralta Creek-Bartlett | 3,256 | $371,600 | $48,575 |
| 87 | Elmhurst Park | 1,971 | $422,667 | $41,152 |
| 88 | Seminary | 4,623 | $464,125 | $48,993 |
| 89 | North Stonehurst | 4,105 | $433,600 | $54,529 |
| 90 | Ralph Bunche | 2,276 | $704,425 | $56,986 |
| 91 | Clawson | 2,185 | $592,750 | $86,830 |
| 92 | South Kennedy Tract | 1,623 | $701,700 | $103,944 |
| 93 | Oak Center | 3,677 | $758,400 | $50,624 |
| 94 | Hawthorne | 2,449 | $628,050 | $42,796 |
| 95 | Frick | 2,993 | $547,733 | $65,517 |
| 96 | Rancho San Antonio | 6,055 | $533,120 | $49,626 |
| 97 | Lynn-Highland Park | 3,096 | $451,950 | $47,757 |
| 98 | Arroyo Viejo | 5,874 | $418,150 | $61,366 |
| 99 | Cox | 3,401 | $429,957 | $48,720 |
| 100 | Old City-Produce And Waterfront | 2,153 | $448,040 | $76,119 |
| 101 | Highland | 2,818 | $398,675 | $39,754 |
| 102 | Fairfax Business-Wentworth-Holland | 2,338 | $293,750 | $44,870 |
| 103 | Mcclymonds | 2,991 | $599,300 | $62,382 |
| 104 | South Stonehurst | 930 | $456,800 | $71,490 |
| 105 | Peralta-Hacienda | 2,486 | $348,300 | $47,859 |
| 106 | Iveywood | 3,875 | $422,333 | $54,228 |
| 107 | Eastmont | 3,424 | $426,967 | $53,836 |
| 108 | Saint Elizabeth | 5,809 | $248,975 | $38,008 |
| 109 | Reservoir Hill-Meadow Brook | 5,292 | $329,143 | $39,638 |
| 110 | Chinatown | 3,163 | $524,900 | $31,838 |
| 111 | Laurel | 1,616 | $462,967 | $51,387 |
| 112 | Webster | 5,190 | $413,514 | $46,842 |
| 113 | Woodland | 1,863 | $362,200 | $41,431 |
| 114 | Arrowhead Marsh | 1,372 | $611,633 | $96,834 |
| 115 | Lockwood Tevis | 2,066 | $361,350 | $40,750 |
| 116 | North Kennedy Tract | 1,319 | $609,800 | $37,994 |
| 117 | East Peralta | 1,744 | $619,367 | $52,764 |
| 118 | Bancroft Business-Havenscourt | 6,963 | $241,371 | $46,110 |
| 119 | Fitchburg | 1,772 | $405,050 | $38,804 |
| 120 | Oakland Airport | 409 | $400,550 | $65,132 |
| 121 | Coliseum | 3,482 | $411,367 | $37,745 |
| 122 | Fruitvale Station | 704 | $372,700 | $23,611 |
| 123 | Peralta-Laney | 694 | $528,450 | $55,739 |
| 124 | Coliseum Industrial | 8,697 | $397,467 | $45,911 |
| 125 | Produce And Waterfront | 1,348 | $177,500 | $73,646 |
| 126 | Melrose | 764 | $387,700 | $52,017 |
| 127 | Acorn-Acorn Industrial | 2,274 | $325,257 | $60,700 |
| 128 | Columbia Gardens | 105 | $328,600 | $44,932 |

