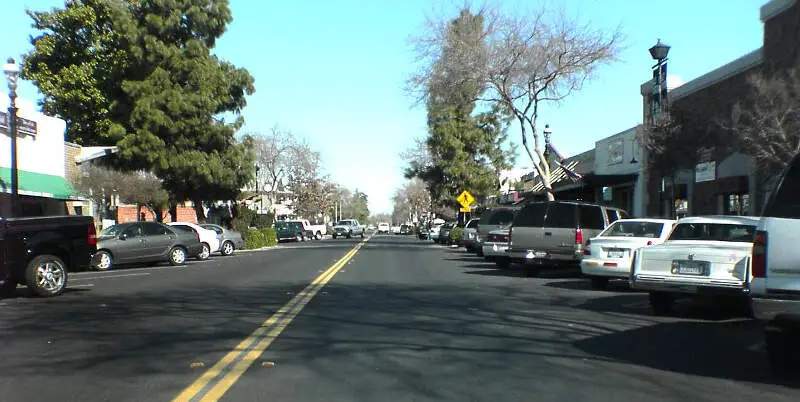

Life in Fresno County research summary. HomeSnacks has been researching the quality of life in Fresno County over the past eight years using Census data, FBI crime data, cost of living data, and other primary sources. Based on the most recently available data, we found the following about life in Fresno County:
The population in Fresno County is 1,008,280.
The median home value in Fresno County is $381,056.
The median income in Fresno County is $67,756.
The median rent in Fresno County is $1,207.
The unemployment rate in Fresno County is 8.6%.
The poverty rate in Fresno County is 19.5%.
The average high in Fresno County is 80.6° and there are 45.2 inches of rainfall annually.
The average high in Fresno County is 80.6°.
There are 71.76 nice days each year.
Expect an average of 45.2 inches of rain each year with 0.2 inches of snow.
There is an average of 8:23 hours of sun each day in Fresno County.
| Stat | Fresno County |
|---|---|
| Mean High | 80.6 |
| Nice Days | 71.76 |
| Rainfall | 45.2 |
| Snowfall | 0.2 |
| Sunny_hours | 8:23 |



The current population in Fresno County is 1,008,280. The population has increased 1.9% from 2019.
| Year | Population | % Change |
|---|---|---|
| 2022 | 1,003,150 | 1.3% |
| 2021 | 990,204 | 0.6% |
| 2020 | 984,521 | - |
Fresno County is 49.8% female with 501,754 female residents.
Fresno County is 50.2% male with 506,526 male residents.
| Gender | Fresno County | CA | USA |
|---|---|---|---|
| Female | 49.8% | 49.9% | 50.4% |
| Male | 50.2% | 50.1% | 49.6% |
Fresno County is:
27.4% White with 275,765 White residents.
4.2% African American with 42,216 African American residents.
0.4% American Indian with 4,220 American Indian residents.
10.4% Asian with 105,291 Asian residents.
0.2% Hawaiian with 1,539 Hawaiian residents.
0.4% Other with 3,787 Other residents.
2.8% Two Or More with 28,688 Two Or More residents.
54.2% Hispanic with 546,774 Hispanic residents.
| Race | Fresno County | CA | USA |
|---|---|---|---|
| White | 27.4% | 35.2% | 58.9% |
| African American | 4.2% | 5.3% | 12.1% |
| American Indian | 0.4% | 0.3% | 0.6% |
| Asian | 10.4% | 14.9% | 5.7% |
| Hawaiian | 0.2% | 0.3% | 0.2% |
| Other | 0.4% | 0.4% | 0.4% |
| Two Or More | 2.8% | 3.8% | 3.5% |
| Hispanic | 54.2% | 39.7% | 18.7% |
6.2% of households in Fresno County earn Less than $10,000.
4.5% of households in Fresno County earn $10,000 to $14,999.
7.8% of households in Fresno County earn $15,000 to $24,999.
8.4% of households in Fresno County earn $25,000 to $34,999.
11.3% of households in Fresno County earn $35,000 to $49,999.
16.2% of households in Fresno County earn $50,000 to $74,999.
12.6% of households in Fresno County earn $75,000 to $99,999.
16.3% of households in Fresno County earn $100,000 to $149,999.
8.0% of households in Fresno County earn $150,000 to $199,999.
8.6% of households in Fresno County earn $200,000 or more.
| Income | Fresno County | CA | USA |
|---|---|---|---|
| Less than $10,000 | 6.2% | 4.4% | 4.9% |
| $10,000 to $14,999 | 4.5% | 3.2% | 3.8% |
| $15,000 to $24,999 | 7.8% | 5.6% | 7.0% |
| $25,000 to $34,999 | 8.4% | 6.0% | 7.4% |
| $35,000 to $49,999 | 11.3% | 8.7% | 10.7% |
| $50,000 to $74,999 | 16.2% | 13.7% | 16.1% |
| $75,000 to $99,999 | 12.6% | 12.0% | 12.8% |
| $100,000 to $149,999 | 16.3% | 17.8% | 17.1% |
| $150,000 to $199,999 | 8.0% | 10.7% | 8.8% |
| $200,000 or more | 8.6% | 17.9% | 11.4% |
11.0% of adults in Fresno County completed < 9th grade.
10.0% of adults in Fresno County completed 9-12th grade.
23.0% of adults in Fresno County completed high school / ged.
23.0% of adults in Fresno County completed some college.
9.0% of adults in Fresno County completed associate's degree.
16.0% of adults in Fresno County completed bachelor's degree.
5.0% of adults in Fresno County completed master's degree.
2.0% of adults in Fresno County completed professional degree.
1.0% of adults in Fresno County completed doctorate degree.
| Education | Fresno County | CA | USA |
|---|---|---|---|
| < 9th Grade | 10% | 8% | 3% |
| 9-12th Grade | 10% | 7% | 6% |
| High School / GED | 23% | 20% | 26% |
| Some College | 23% | 20% | 20% |
| Associate's Degree | 9% | 8% | 9% |
| Bachelor's Degree | 16% | 22% | 21% |
| Master's Degree | 5% | 9% | 10% |
| Professional Degree | 2% | 3% | 2% |
| Doctorate Degree | 1% | 2% | 2% |
HomeSnacks is based in Durham, NC.
We aim to deliver bite-sized pieces of infotainment about where you live.
We use data, analytics, and a sense of humor to determine quality of life for places across the nation.