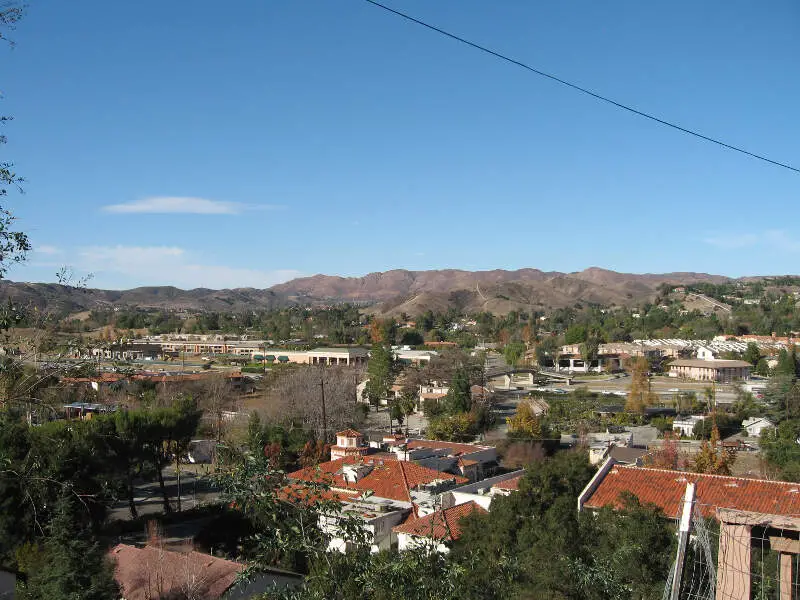
Los Angeles County Summary

Life in Los Angeles County research summary. HomeSnacks has been researching the quality of life in Los Angeles County over the past eight years using Census data, FBI crime data, cost of living data, and other primary sources. Based on the most recently available data, we found the following about life in Los Angeles County:

  • The population in Los Angeles County is 9,936,690.

  • The median home value in Los Angeles County is $841,358.

  • The median income in Los Angeles County is $83,411.

  • The median rent in Los Angeles County is $1,805.

  • The unemployment rate in Los Angeles County is 7.0%.

  • The poverty rate in Los Angeles County is 13.7%.

  • The average high in Los Angeles County is 73.0° and there are 35.2 inches of rainfall annually.

Cities & Towns in Los Angeles County

List Of Cities & Towns in Los Angeles County

Los Angeles, CA Population 3,881,041

Long Beach, CA Population 462,293

Santa Clarita, CA Population 225,850

Glendale, CA Population 194,512

Lancaster, CA Population 171,465

Palmdale, CA Population 166,895

Pomona, CA Population 149,831

Torrance, CA Population 145,454

Pasadena, CA Population 137,554

East Los Angeles, CA Population 117,222

Downey, CA Population 113,052

El Monte, CA Population 108,682

West Covina, CA Population 108,173

Inglewood, CA Population 106,806

Burbank, CA Population 106,389

Norwalk, CA Population 101,893

Compton, CA Population 94,822

Carson, CA Population 94,475

South Gate, CA Population 92,381

Santa Monica, CA Population 92,168

Hawthorne, CA Population 86,978

Whittier, CA Population 86,459

Alhambra, CA Population 82,295

Lakewood, CA Population 81,499

Bellflower, CA Population 78,352

Baldwin Park, CA Population 71,692

Redondo Beach, CA Population 70,620

Lynwood, CA Population 66,346

Florence-Graham, CA Population 63,132

Montebello, CA Population 62,056

Pico Rivera, CA Population 61,561

Monterey Park, CA Population 60,386

Gardena, CA Population 60,377

South Whittier, CA Population 57,383

Arcadia, CA Population 56,181

Hacienda Heights, CA Population 55,461

Huntington Park, CA Population 54,547

Diamond Bar, CA Population 54,534

Paramount, CA Population 53,255

Glendora, CA Population 52,095

Rosemead, CA Population 51,043

Covina, CA Population 50,717

Azusa, CA Population 49,704

Cerritos, CA Population 49,016

La Mirada, CA Population 47,644

Rowland Heights, CA Population 47,209

Altadena, CA Population 42,719

Rancho Palos Verdes, CA Population 41,805

Culver City, CA Population 40,357

Bell Gardens, CA Population 39,263

San Gabriel, CA Population 39,211

La Puente, CA Population 37,835

Monrovia, CA Population 37,656

Claremont, CA Population 36,891

Temple City, CA Population 36,165

West Hollywood, CA Population 35,358

Westmont, CA Population 35,345

Manhattan Beach, CA Population 35,123

San Dimas, CA Population 34,466

Bell, CA Population 33,377

Beverly Hills, CA Population 32,406

Lawndale, CA Population 31,553

La Verne, CA Population 31,239

Walnut, CA Population 28,212

South Pasadena, CA Population 26,583

Maywood, CA Population 25,009

San Fernando, CA Population 23,958

Calabasas, CA Population 23,106

Cudahy, CA Population 22,657

East San Gabriel, CA Population 22,654

Willowbrook, CA Population 22,491

West Carson, CA Population 22,240

West Rancho Dominguez, CA Population 22,141

West Puente Valley, CA Population 22,074

Valinda, CA Population 21,952

Duarte, CA Population 21,686

Lennox, CA Population 20,687

Lomita, CA Population 20,662

Stevenson Ranch, CA Population 20,484

La Crescenta-Montrose, CA Population 20,092

Agoura Hills, CA Population 20,088

South El Monte, CA Population 19,694

Hermosa Beach, CA Population 19,551

Santa Fe Springs, CA Population 18,840

South San Jose Hills, CA Population 18,717

Castaic, CA Population 18,643

El Segundo, CA Population 17,081

Artesia, CA Population 16,237

Walnut Park, CA Population 16,209

Vincent, CA Population 15,266

East Rancho Dominguez, CA Population 14,924

Hawaiian Gardens, CA Population 14,011

Avocado Heights, CA Population 13,470

Palos Verdes Estates, CA Population 13,219

Lake Los Angeles, CA Population 13,097

San Marino, CA Population 12,442

Commerce, CA Population 12,253

Signal Hill, CA Population 11,678

Sun Village, CA Population 11,472

Sierra Madre, CA Population 11,151

Citrus, CA Population 10,979

Del Aire, CA Population 10,756

Malibu, CA Population 10,698

Marina del Rey, CA Population 10,274

East Whittier, CA Population 10,248

Quartz Hill, CA Population 10,089

Charter Oak, CA Population 9,335

West Athens, CA Population 9,131

Alondra Park, CA Population 8,314

Topanga, CA Population 8,202

Westlake Village, CA Population 7,948

South San Gabriel, CA Population 7,786

Acton, CA Population 7,286

Ladera Heights, CA Population 6,710

La Habra Heights, CA Population 5,599

East Pasadena, CA Population 5,474

Mayflower Village, CA Population 5,209

North El Monte, CA Population 3,983

Avalon, CA Population 3,441

Val Verde, CA Population 3,292

Desert View Highlands, CA Population 3,275

Agua Dulce, CA Population 3,161

Rose Hills, CA Population 2,718

Hidden Hills, CA Population 2,107

San Pasqual, CA Population 1,934

Elizabeth Lake, CA Population 1,764

Leona Valley, CA Population 1,569

Littlerock, CA Population 1,509

Rolling Hills, CA Population 1,451

Irwindale, CA Population 1,343

Hasley Canyon, CA Population 1,236

Lake Hughes, CA Population 867

Green Valley CDP (Los Angeles County), CA Population 832

Bradbury, CA Population 767

Vernon, CA Population 329

Industry, CA Population 234

Map Of Los Angeles County

Los Angeles County, CA Weather

  • The average high in Los Angeles County is 73.0°.

  • There are 92.6 nice days each year.

  • Expect an average of 35.2 inches of rain each year with 0.1 inches of snow.

  • There is an average of 8:16 hours of sun each day in Los Angeles County.

StatLos Angeles County
Mean High73.0
Nice Days92.6
Rainfall35.2
Snowfall0.1
Sunny_hours8:16
73.0°
Average High
35.2
Inches of Rain

Los Angeles County Photos

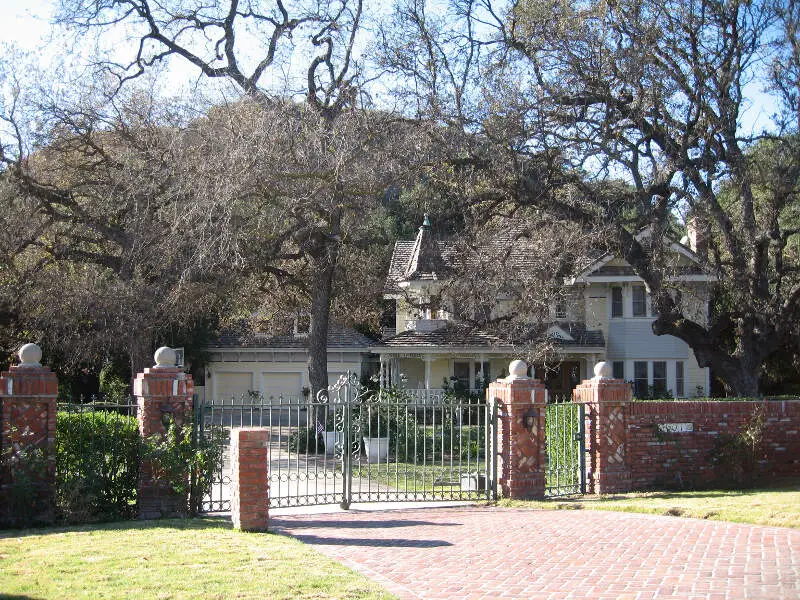
Agouravista
Source: Wikipedia User Arspickles17 at English W | GFDL
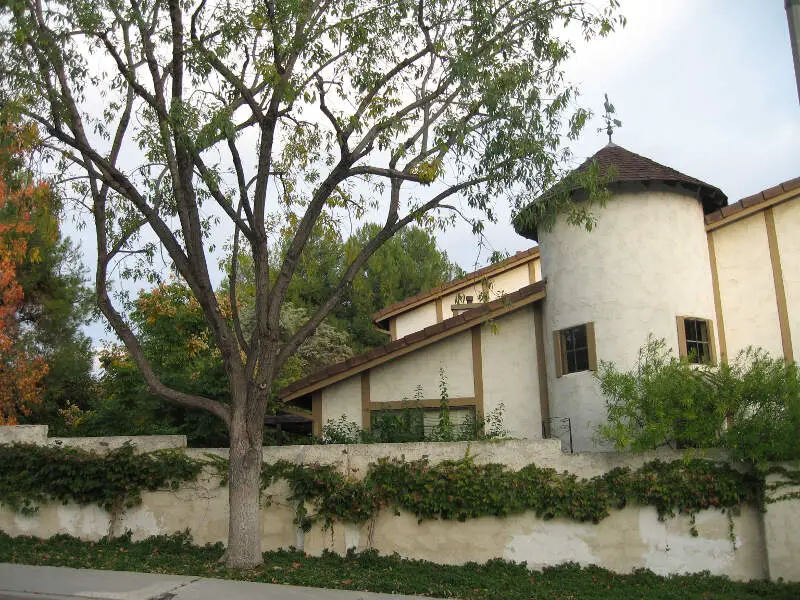
Agouraestate
Source: Wikipedia User Arspickles17 | GFDL
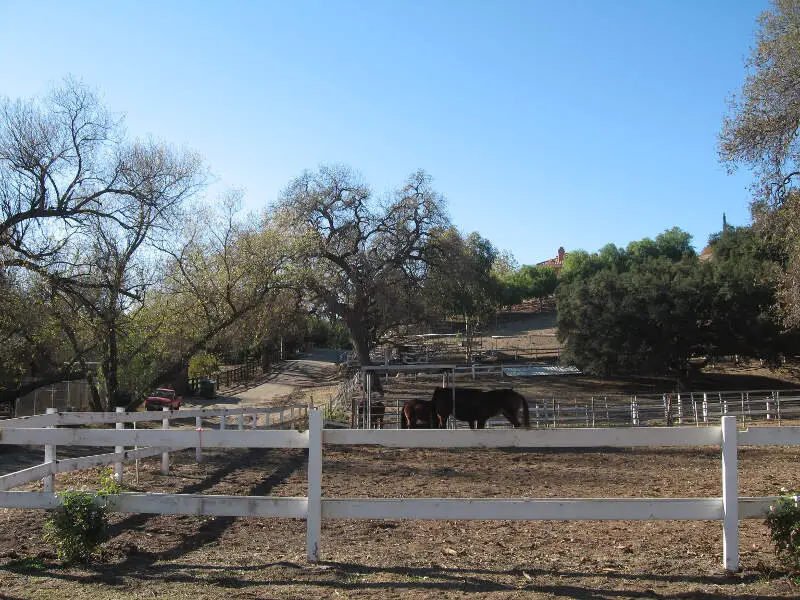
Westlake Village And Agoura Hills California Usa
Source: Wikipedia User Weedwhacker128 | CC BY-SA 3.0
Strawberryhillapartments
Source: Wikipedia User Arspickles17 | GFDL
Oldagoura
Source: Wikipedia User Arspickles17 | GFDL
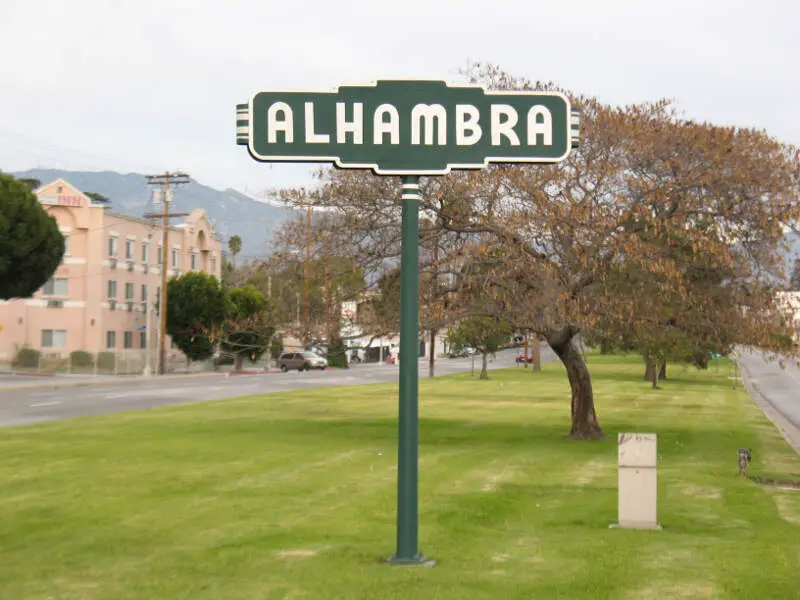
Alhambrac Ca
Source: Wikipedia User Jey0h (talk) | CC BY 3.0

Los Angeles County Demographics

Population over time in Los Angeles County

The current population in Los Angeles County is 9,936,690. The population has decreased -0.6% from 2019.

Year Population % Change
2022 10,019,635 -0.2%
2021 10,040,682 -0.4%
2020 10,081,570 -

Gender in Los Angeles County

  • Los Angeles County is 50.3% female with 4,999,589 female residents.

  • Los Angeles County is 49.7% male with 4,937,101 male residents.

Female
50.3% (4,999,589)
Male
49.7% (4,937,101)
Gender Los Angeles County CA USA
Female 50.3% 49.9% 50.4%
Male 49.7% 50.1% 49.6%

Race / Ethnicity in Los Angeles County

Los Angeles County is:

  • 25.2% White with 2,505,177 White residents.

  • 7.6% African American with 753,155 African American residents.

  • 0.2% American Indian with 18,662 American Indian residents.

  • 14.6% Asian with 1,452,646 Asian residents.

  • 0.2% Hawaiian with 20,597 Hawaiian residents.

  • 0.5% Other with 49,953 Other residents.

  • 3.0% Two Or More with 298,906 Two Or More residents.

  • 48.7% Hispanic with 4,837,594 Hispanic residents.

White
25.2% (2,505,177)
African American
7.6% (753,155)
American Indian
0.2% (18,662)
Asian
14.6% (1,452,646)
Hawaiian
0.2% (20,597)
Other
0.5% (49,953)
Two Or More
3.0% (298,906)
Hispanic
48.7% (4,837,594)

Table: Los Angeles County By Race

Race Los Angeles County CA USA
White 25.2% 35.2% 58.9%
African American 7.6% 5.3% 12.1%
American Indian 0.2% 0.3% 0.6%
Asian 14.6% 14.9% 5.7%
Hawaiian 0.2% 0.3% 0.2%
Other 0.5% 0.4% 0.4%
Two Or More 3.0% 3.8% 3.5%
Hispanic 48.7% 39.7% 18.7%

Household Income For Los Angeles County, California

  • 5.2% of households in Los Angeles County earn Less than $10,000.

  • 3.9% of households in Los Angeles County earn $10,000 to $14,999.

  • 6.2% of households in Los Angeles County earn $15,000 to $24,999.

  • 6.6% of households in Los Angeles County earn $25,000 to $34,999.

  • 9.3% of households in Los Angeles County earn $35,000 to $49,999.

  • 14.4% of households in Los Angeles County earn $50,000 to $74,999.

  • 12.2% of households in Los Angeles County earn $75,000 to $99,999.

  • 17.4% of households in Los Angeles County earn $100,000 to $149,999.

  • 9.8% of households in Los Angeles County earn $150,000 to $199,999.

  • 14.9% of households in Los Angeles County earn $200,000 or more.

Less than $10,000
5.2% (518,020)
$10,000 to $14,999
3.9% (389,830)
$15,000 to $24,999
6.2% (617,863)
$25,000 to $34,999
6.6% (652,508)
$35,000 to $49,999
9.3% (919,388)
$50,000 to $74,999
14.4% (1,434,758)
$75,000 to $99,999
12.2% (1,216,450)
$100,000 to $149,999
17.4% (1,731,624)
$150,000 to $199,999
9.8% (974,950)
$200,000 or more
14.9% (1,481,294)
Income Los Angeles County CA USA
Less than $10,000 5.2% 4.4% 4.9%
$10,000 to $14,999 3.9% 3.2% 3.8%
$15,000 to $24,999 6.2% 5.6% 7.0%
$25,000 to $34,999 6.6% 6.0% 7.4%
$35,000 to $49,999 9.3% 8.7% 10.7%
$50,000 to $74,999 14.4% 13.7% 16.1%
$75,000 to $99,999 12.2% 12.0% 12.8%
$100,000 to $149,999 17.4% 17.8% 17.1%
$150,000 to $199,999 9.8% 10.7% 8.8%
$200,000 or more 14.9% 17.9% 11.4%

Highest level of educational attainment in Los Angeles County for adults over 25

  • 13.0% of adults in Los Angeles County completed < 9th grade.

  • 8.0% of adults in Los Angeles County completed 9-12th grade.

  • 20.0% of adults in Los Angeles County completed high school / ged.

  • 18.0% of adults in Los Angeles County completed some college.

  • 7.0% of adults in Los Angeles County completed associate's degree.

  • 22.0% of adults in Los Angeles County completed bachelor's degree.

  • 8.0% of adults in Los Angeles County completed master's degree.

  • 3.0% of adults in Los Angeles County completed professional degree.

  • 1.0% of adults in Los Angeles County completed doctorate degree.

< 9th Grade
13% (1,291,769)
9-12th Grade
8% (794,935)
High School / GED
20% (1,987,338)
Some College
18% (1,788,604)
Associate's Degree
7% (695,568)
Bachelor's Degree
22% (2,186,071)
Master's Degree
8% (794,935)
Professional Degree
3% (298,100)
Doctorate Degree
1% (99,366)
Education Los Angeles County CA USA
< 9th Grade 13% 8% 3%
9-12th Grade 8% 7% 6%
High School / GED 20% 20% 26%
Some College 18% 20% 20%
Associate's Degree 7% 8% 9%
Bachelor's Degree 22% 22% 21%
Master's Degree 8% 9% 10%
Professional Degree 3% 3% 2%
Doctorate Degree 1% 2% 2%

Articles About California

Enjoy The Snack?

About HomeSnacks

HomeSnacks is based in Durham, NC.

We aim to deliver bite-sized pieces of infotainment about where you live.

We use data, analytics, and a sense of humor to determine quality of life for places across the nation.

© Chasing Chains, LLC. All rights reserved.