Everything else equal, we can all agree that living in a cheaper place is better than living in a more expensive place.
I’d much rather pay $500/mo in rent than $1,000. And I’d rather pay $2 for coffee than $5.
And while every neighbhorhood in Chicago might be more expensive than living in rural Illinois, there are certain neighborhoods that are definitely cheaper.
What exactly are those Chicago neighborhoods where your dollar goes a little further — you can get that one bedroom instead of the studio?
Instead of relying on public opinion and speculation, we wanted to get the facts straight and determine which neighborhoods in Chicago are the cheapest using Saturday Night Science.
What’s the cheapest neighborhood to live in Chicago for 2024? According to the most recent census data, East Side looks to be the cheapest Chicago neighborhood to live in.
At this point, we should make it clear that you do get what you pay for — some of these neighborhoods might not be the best places to live in Chicago. You could be sacrificing location or crime rates for more space and cheaper groceries.
Read on to see how we determined the places around Chicago that deserve a little bragging rights, or maybe you’re interested in the worst neighborhoods in Chicago.
For more Illinois reading, check out:
- Best Places To Live In Illinois
- Cheapest Places To Live In Illinois
- Cheapest Cities To Live In America
- Cheapest States To Live In America
Table Of Contents: Top Ten | Methodology | Summary | Table
The 10 Cheapest Neighborhoods To Live In Chicago For 2024
/10
Population: 20,439
Cost Of Living Index: 97 (14th cheapest)
Home Value To Income Ratio: 2.2 (cheapest)
Rent To Income Ratio: 0.018 (29th cheapest)
More on East Side: Data | Real Estate
/10
Population: 24,934
Cost Of Living Index: 102 (34th cheapest)
Home Value To Income Ratio: 2.8 (11th cheapest)
Rent To Income Ratio: 0.011 (5th cheapest)
More on Clearing: Data | Real Estate
/10
Population: 16,972
Cost Of Living Index: 105 (42nd cheapest)
Home Value To Income Ratio: 2.5 (6th cheapest)
Rent To Income Ratio: 0.012 (6th cheapest)
More on Mount Greenwood: Data | Real Estate
/10
Population: 29,267
Cost Of Living Index: 104 (40th cheapest)
Home Value To Income Ratio: 2.8 (10th cheapest)
Rent To Income Ratio: 0.012 (7th cheapest)
More on Garfield Ridge: Data | Real Estate

/10
Population: 28,988
Cost Of Living Index: 94 (4th cheapest)
Home Value To Income Ratio: 3.2 (15th cheapest)
Rent To Income Ratio: 0.02 (42nd cheapest)
More on South Chicago: Data | Real Estate
/10
Population: 18,486
Cost Of Living Index: 102 (34th cheapest)
Home Value To Income Ratio: 3.1 (14th cheapest)
Rent To Income Ratio: 0.016 (14th cheapest)
More on West Elsdon: Data | Real Estate
/10
Population: 10,401
Cost Of Living Index: 100 (27th cheapest)
Home Value To Income Ratio: 2.4 (5th cheapest)
Rent To Income Ratio: 0.018 (32nd cheapest)
More on Calumet Heights: Data | Real Estate

/10
Population: 8,750
Cost Of Living Index: 94 (4th cheapest)
Home Value To Income Ratio: 3.1 (13th cheapest)
Rent To Income Ratio: 0.021 (47th cheapest)
More on Burnside: Data | Real Estate
/10
Population: 14,277
Cost Of Living Index: 98 (18th cheapest)
Home Value To Income Ratio: 2.3 (4th cheapest)
Rent To Income Ratio: 0.02 (44th cheapest)
More on Ashburn: Data | Real Estate

/10
Population: 13,407
Cost Of Living Index: 114 (57th cheapest)
Home Value To Income Ratio: 2.5 (7th cheapest)
Rent To Income Ratio: 0.008 (2nd cheapest)
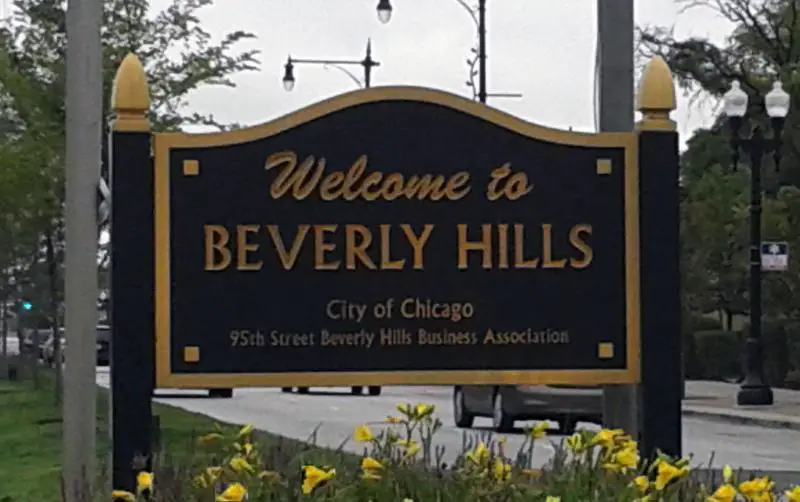
More on Beverly: Data | Real Estate
Methodology: How We Determined The Cheapest Chicago Hoods In 2024
To rank the cheapest places to live in Chicago, we had to determine what criteria define “cheap” and then apply Saturday Night Science.
Using Census and extrapolated BLS data, we arrived at the following set of criteria:
- Overall Cost Of Living
- Rent To Income Ratio
- Median Home Value To Income Ratio
We then ranked each neighborhood with scores from 1 to 77 in each category, where 1 was the cheapest.
Next, we averaged the rankings for each neighborhood to create a cheap neighborhood index.
And finally, we crowned the neighborhood with the lowest cheapest neighborhood index, the “Cheapest City Neighborhood In Chicago.” We’re lookin’ at you, East Side.
We updated this article for 2024. This is our fourth time ranking the cheapest neighborhoods to live in Chicago. Skip to the end to see the list of all the neighborhoods in the city, from cheapest to most expensive.
Summary: Lowest Cost Places To Live In Chicago
If you’re measuring the neighborhoods in Chicago where prices are low, and it’s cheap to live, this is an accurate list.
The most affordable neighborhoods in Chicago are East Side, Clearing, Mount Greenwood, Garfield Ridge, South Chicago, West Elsdon, Calumet Heights, Burnside, Ashburn, and Beverly.
As mentioned earlier, the neighborhoods in Chicago aren’t all cheap. Armour Square takes the title of the most expensive neighborhood to live in Chicago.
The most expensive neighborhoods in Chicago are Armour Square, Hyde Park, East Garfield Park, Near West Side, and Archer Heights.
We ranked the neighborhoods from cheapest to most expensive in the chart below.
For more Illinois reading, check out:
- Most Dangerous Cities In Illinois
- Richest Cities In Illinois
- Safest Places In Illinois
- Worst Places To Live In Illinois

