100 Biggest Cities In Nebraska For 2023
Using the latest Census data, we detail the 100 biggest cities in Nebraska. You can all see a comprehensive list of all 124 cities and places in Nebraska.
Article Table Of Contents
We all love the biggest cities that the Cornhusker State has to offer. You know the places like Omaha and Lincoln which make all the headlines.
But there are a bunch of other great large cities in Nebraska that don't get as much love.
We're going to change that right now.
Using the most recent Census data, we can tell you about all the places in Nebraska with a focus on the biggest. We update the data each year and this is our fourth time doing this.
The Largest Cities In Nebraska For 2023:
You can click here to see a full table of the full of the 100 biggest cities in Nebraska, along with every other place over 1,000 people big. It is sortable by clicking on the headers.
Read on below to see more on the biggest cities. Or for more reading on places to live in Nebraska, check out:
- Best Places To Live In Nebraska
- Cheapest Places To Live In Nebraska
- Most Dangerous Cities In Nebraska
The 10 Biggest Cities In Nebraska

/10
Rank Last Year: 1 (No Change)
Population: 479,529
Population 2010: 407,334
Growth: 17.7%
More on Omaha: Crime Report | Homes For Sale | Data
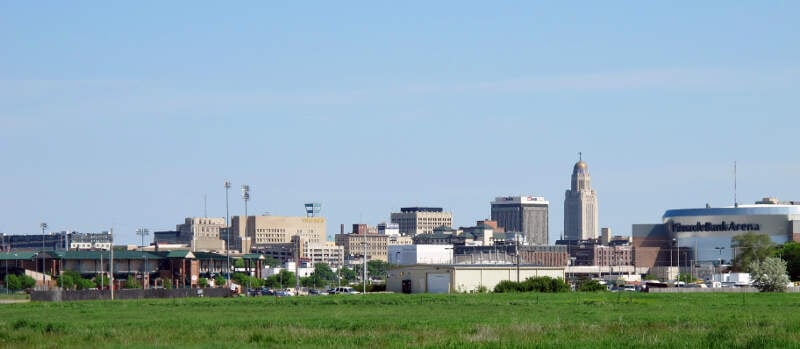
/10
Rank Last Year: 2 (No Change)
Population: 286,388
Population 2010: 253,035
Growth: 13.2%
More on Lincoln: Crime Report | Homes For Sale | Data

/10
Rank Last Year: 3 (No Change)
Population: 63,970
Population 2010: 50,241
Growth: 27.3%
More on Bellevue: Crime Report | Homes For Sale | Data

/10
Rank Last Year: 4 (No Change)
Population: 51,250
Population 2010: 46,975
Growth: 9.1%
More on Grand Island: Crime Report | Homes For Sale | Data
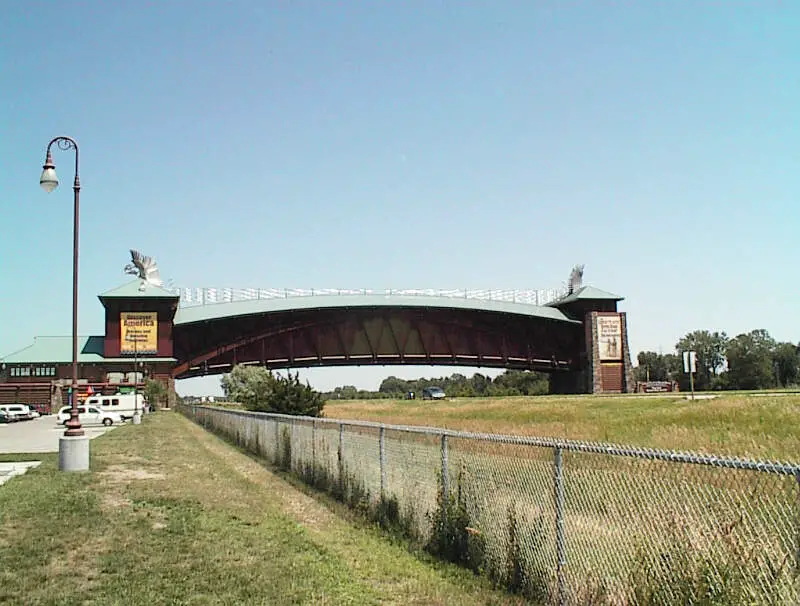
/10
Rank Last Year: 5 (No Change)
Population: 33,783
Population 2010: 30,214
Growth: 11.8%
More on Kearney: Crime Report | Homes For Sale | Data
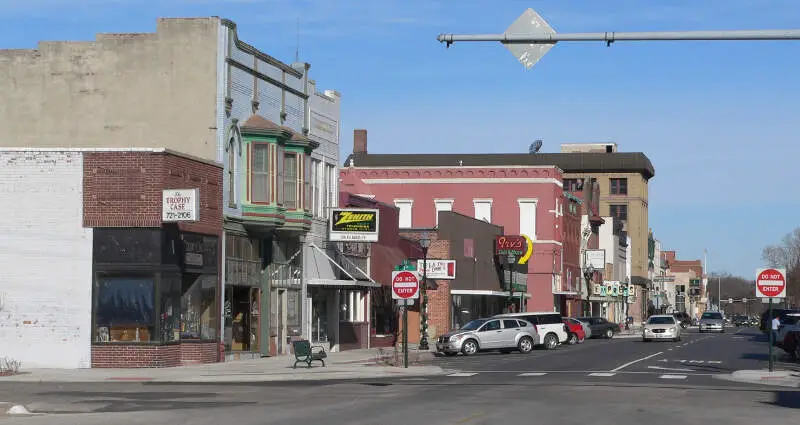
/10
Rank Last Year: 6 (No Change)
Population: 26,362
Population 2010: 26,223
Growth: 0.5%
More on Fremont: Crime Report | Homes For Sale | Data
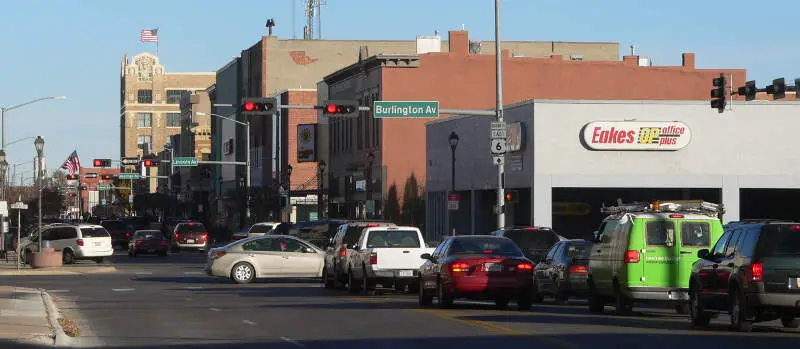
/10
Rank Last Year: 7 (No Change)
Population: 24,878
Population 2010: 24,717
Growth: 0.7%
More on Hastings: Crime Report | Homes For Sale | Data
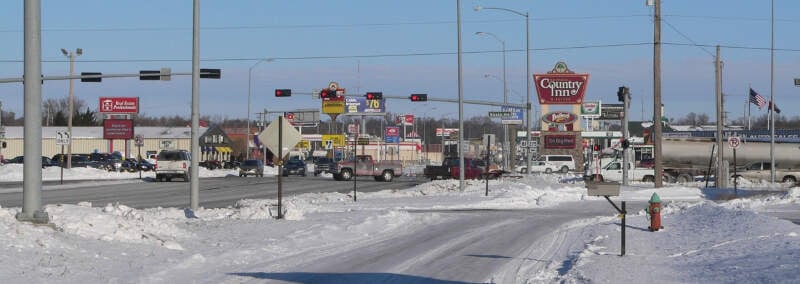
/10
Rank Last Year: 9 (Up 1)
Population: 24,410
Population 2010: 23,961
Growth: 1.9%
More on Norfolk: Crime Report | Homes For Sale | Data
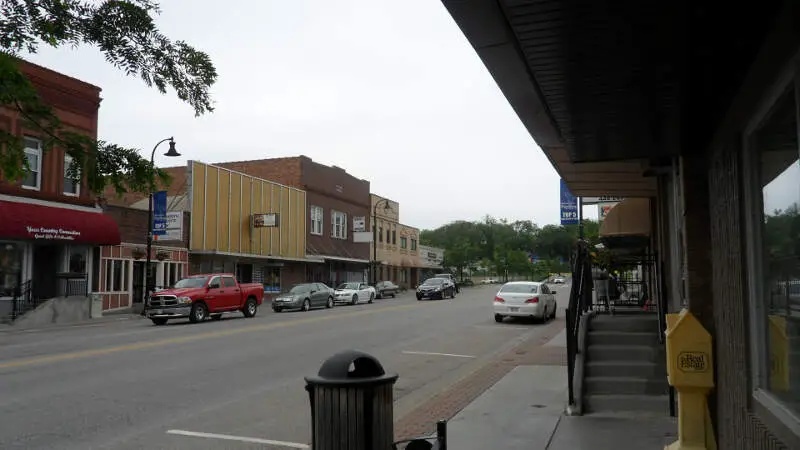
/10
Rank Last Year: 11 (Up 2)
Population: 24,310
Population 2010: 18,829
Growth: 29.1%
More on Papillion: Crime Report | Homes For Sale | Data
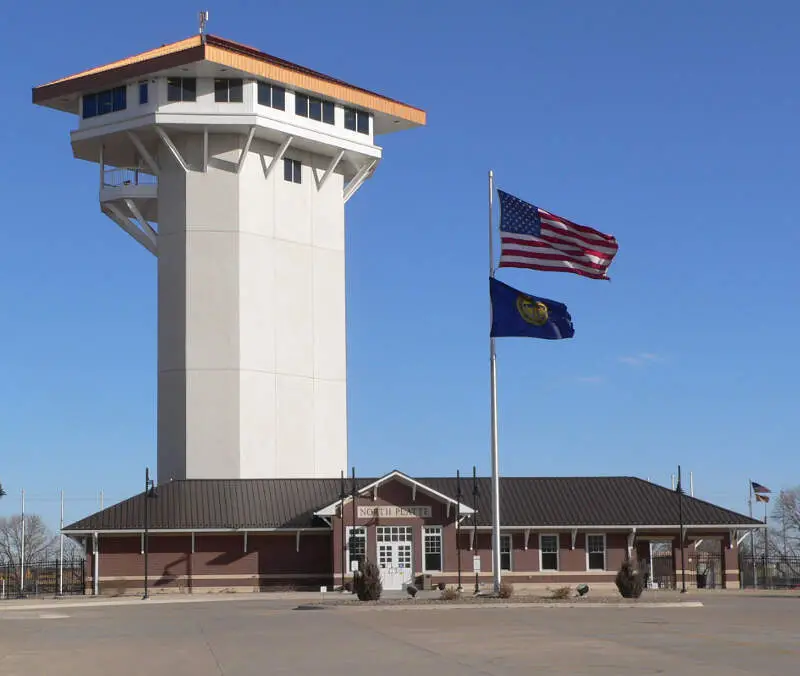
/10
Rank Last Year: 8 (Down 2)
Population: 23,734
Population 2010: 24,722
Growth: -4.0%
More on North Platte: Crime Report | Homes For Sale | Data
How We Determined The Largest Cities In Nebraska
We've been ranking and dissecting cities in the Cornhusker State for over 4 years now -- making this actually the fourth time we've run the numbers. We always use the best data, the US Census. In this case, that means we are using the 2013-2017 American Community Survey.
It what is probably the most simple analysis we run each year, we ranked every place in Nebraska from biggest to smallest. The biggest city this year? That would be Omaha.
The smallest? Loup City, although there are places smaller than 1,000 people not listed here, so keep that in mind as we take a look at the top ten.
Now on to numbers 11-100 Biggest in Nebraska
We hope that you find the big city, or really any city, that's right for you. Below is a list of the rest of the biggest cities along with every other place in Nebraska.
Have fun snacking around in the Cornhusker State!
For more reading on Nebraska, check out:
- Best Places To Raise A Family In Nebraska
- Best Places To Retire In Nebraska
- Richest Cities In Nebraska
- Safest Places In Nebraska
- Worst Places To Live In Nebraska
- Most Expensive Places To Live In Nebraska
Detailed List Of The Biggest Cities In Nebraska
| Rank | City | Current Population | 2010 | Growth | |||||
|---|---|---|---|---|---|---|---|---|---|
| 1 | Omaha | 479,529 | 407,334 | 17.7% | |||||
| 2 | Lincoln | 286,388 | 253,035 | 13.2% | |||||
| 3 | Bellevue | 63,970 | 50,241 | 27.3% | |||||
| 4 | Grand Island | 51,250 | 46,975 | 9.1% | |||||
| 5 | Kearney | 33,783 | 30,214 | 11.8% | |||||
| 6 | Fremont | 26,362 | 26,223 | 0.5% | |||||
| 7 | Hastings | 24,878 | 24,717 | 0.7% | |||||
| 8 | Norfolk | 24,410 | 23,961 | 1.9% | |||||
| 9 | Papillion | 24,310 | 18,829 | 29.1% | |||||
| 10 | North Platte | 23,734 | 24,722 | -4.0% | |||||
| 11 | Columbus | 23,291 | 21,640 | 7.6% | |||||
| 12 | La Vista | 17,081 | 15,044 | 13.5% | |||||
| 13 | Scottsbluff | 14,660 | 14,841 | -1.2% | |||||
| 14 | South Sioux City | 12,867 | 12,977 | -0.8% | |||||
| 15 | Beatrice | 12,282 | 12,584 | -2.4% | |||||
| 16 | Chalco | 10,092 | 10,732 | -6.0% | |||||
| 17 | Lexington | 10,069 | 10,111 | -0.4% | |||||
| 18 | Gering | 8,179 | 8,271 | -1.1% | |||||
| 19 | Alliance | 8,139 | 8,524 | -4.5% | |||||
| 20 | Blair | 7,830 | 7,980 | -1.9% | |||||
| 21 | York | 7,810 | 7,869 | -0.7% | |||||
| 22 | Mccook | 7,555 | 7,729 | -2.3% | |||||
| 23 | Ralston | 7,305 | 5,961 | 22.5% | |||||
| 24 | Nebraska City | 7,270 | 7,300 | -0.4% | |||||
| 25 | Seward | 7,210 | 6,846 | 5.3% | |||||
| 26 | Crete | 7,013 | 6,801 | 3.1% | |||||
| 27 | Plattsmouth | 6,453 | 6,599 | -2.2% | |||||
| 28 | Sidney | 6,451 | 6,748 | -4.4% | |||||
| 29 | Schuyler | 6,269 | 5,931 | 5.7% | |||||
| 30 | Wayne | 5,603 | 5,585 | 0.3% | |||||
| 31 | Chadron | 5,482 | 5,812 | -5.7% | |||||
| 32 | Holdrege | 5,406 | 5,499 | -1.7% | |||||
| 33 | Offutt Afb | 5,280 | 4,581 | 15.3% | |||||
| 34 | Gretna | 5,039 | 4,164 | 21.0% | |||||
| 35 | Aurora | 4,523 | 4,429 | 2.1% | |||||
| 36 | Wahoo | 4,520 | 4,418 | 2.3% | |||||
| 37 | Ogallala | 4,509 | 4,748 | -5.0% | |||||
| 38 | Falls City | 4,139 | 4,340 | -4.6% | |||||
| 39 | Waverly | 3,941 | 3,131 | 25.9% | |||||
| 40 | Cozad | 3,776 | 3,990 | -5.4% | |||||
| 41 | Fairbury | 3,657 | 4,016 | -8.9% | |||||
| 42 | O'neill | 3,594 | 3,657 | -1.7% | |||||
| 43 | Broken Bow | 3,503 | 3,538 | -1.0% | |||||
| 44 | Gothenburg | 3,469 | 3,573 | -2.9% | |||||
| 45 | Auburn | 3,306 | 3,450 | -4.2% | |||||
| 46 | West Point | 3,282 | 3,383 | -3.0% | |||||
| 47 | Minden | 2,906 | 2,516 | 15.5% | |||||
| 48 | Central City | 2,906 | 2,900 | 0.2% | |||||
| 49 | Valley | 2,834 | 1,961 | 44.5% | |||||
| 50 | Ashland | 2,834 | 2,469 | 14.8% | |||||
| 51 | David City | 2,824 | 2,817 | 0.2% | |||||
| 52 | Valentine | 2,768 | 2,765 | 0.1% | |||||
| 53 | St. Paul | 2,638 | 2,080 | 26.8% | |||||
| 54 | Hickman | 2,432 | 1,467 | 65.8% | |||||
| 55 | Milford | 2,417 | 2,241 | 7.9% | |||||
| 56 | Kimball | 2,276 | 2,597 | -12.4% | |||||
| 57 | Dakota City | 2,249 | 2,170 | 3.6% | |||||
| 58 | Madison | 2,239 | 2,688 | -16.7% | |||||
| 59 | Imperial | 2,163 | 2,036 | 6.2% | |||||
| 60 | Ord | 2,112 | 2,208 | -4.3% | |||||
| 61 | Wilber | 2,086 | 1,828 | 14.1% | |||||
| 62 | Bennington | 2,075 | 1,168 | 77.7% | |||||
| 63 | Syracuse | 2,043 | 1,810 | 12.9% | |||||
| 64 | Pierce | 1,973 | 2,105 | -6.3% | |||||
| 65 | Gibbon | 1,971 | 1,796 | 9.7% | |||||
| 66 | Geneva | 1,955 | 2,071 | -5.6% | |||||
| 67 | Mitchell | 1,907 | 1,675 | 13.9% | |||||
| 68 | Stanton | 1,847 | 1,972 | -6.3% | |||||
| 69 | Superior | 1,826 | 1,820 | 0.3% | |||||
| 70 | Tecumseh | 1,818 | 1,690 | 7.6% | |||||
| 71 | Gordon | 1,764 | 1,634 | 8.0% | |||||
| 72 | Tekamah | 1,727 | 1,522 | 13.5% | |||||
| 73 | Arlington | 1,657 | 1,487 | 11.4% | |||||
| 74 | Ainsworth | 1,655 | 1,891 | -12.5% | |||||
| 75 | Hebron | 1,654 | 1,534 | 7.8% | |||||
| 76 | Sutherland | 1,597 | 1,165 | 37.1% | |||||
| 77 | Neligh | 1,586 | 1,672 | -5.1% | |||||
| 78 | Springfield | 1,582 | 1,343 | 17.8% | |||||
| 79 | Oakland | 1,575 | 1,362 | 15.6% | |||||
| 80 | Fullerton | 1,569 | 1,525 | 2.9% | |||||
| 81 | Hartington | 1,522 | 1,782 | -14.6% | |||||
| 82 | Albion | 1,511 | 1,675 | -9.8% | |||||
| 83 | Battle Creek | 1,503 | 984 | 52.7% | |||||
| 84 | Wood River | 1,503 | 1,481 | 1.5% | |||||
| 85 | Ravenna | 1,465 | 1,213 | 20.8% | |||||
| 86 | North Bend | 1,453 | 1,241 | 17.1% | |||||
| 87 | Plainview | 1,440 | 1,291 | 11.5% | |||||
| 88 | Louisville | 1,425 | 1,286 | 10.8% | |||||
| 89 | Woodland Park | 1,418 | 1,407 | 0.8% | |||||
| 90 | Bridgeport | 1,414 | 1,792 | -21.1% | |||||
| 91 | Alma | 1,410 | 1,234 | 14.3% | |||||
| 92 | Atkinson | 1,403 | 1,136 | 23.5% | |||||
| 93 | Grant | 1,393 | 1,226 | 13.6% | |||||
| 94 | Wymore | 1,385 | 1,570 | -11.8% | |||||
| 95 | Wakefield | 1,375 | 1,395 | -1.4% | |||||
| 96 | Sutton | 1,368 | 1,468 | -6.8% | |||||
| 97 | Wisner | 1,364 | 1,124 | 21.4% | |||||
| 98 | Ceresco | 1,343 | 1,083 | 24.0% | |||||
| 99 | Bayard | 1,319 | 1,148 | 14.9% | |||||
| 100 | Cambridge | 1,285 | 1,020 | 26.0% | |||||
| 101 | Creighton | 1,253 | 1,281 | -2.2% | |||||
| 102 | Arapahoe | 1,242 | 1,128 | 10.1% | |||||
| 103 | Shelton | 1,241 | 969 | 28.1% | |||||
| 104 | Pender | 1,216 | 1,125 | 8.1% | |||||
| 105 | Burwell | 1,215 | 1,279 | -5.0% | |||||
| 106 | Harvard | 1,184 | 967 | 22.4% | |||||
| 107 | Friend | 1,173 | 941 | 24.7% | |||||
| 108 | Elm Creek | 1,136 | 941 | 20.7% | |||||
| 109 | Cairo | 1,123 | 843 | 33.2% | |||||
| 110 | Red Cloud | 1,091 | 1,135 | -3.9% | |||||
| 111 | Kenesaw | 1,088 | 944 | 15.3% | |||||
| 112 | Bennet | 1,088 | 695 | 56.5% | |||||
| 113 | Randolph | 1,084 | 997 | 8.7% | |||||
| 114 | Tilden | 1,079 | 1,047 | 3.1% | |||||
| 115 | Yutan | 1,075 | 1,154 | -6.8% | |||||
| 116 | Utica | 1,069 | 854 | 25.2% | |||||
| 117 | Waterloo | 1,066 | 725 | 47.0% | |||||
| 118 | Stromsburg | 1,028 | 1,214 | -15.3% | |||||
| 119 | Laurel | 1,027 | 922 | 11.4% | |||||
| 120 | Crawford | 1,020 | 920 | 10.9% | |||||
| 121 | Terrytown | 1,013 | 912 | 11.1% | |||||
| 122 | Weeping Water | 1,011 | 1,194 | -15.3% | |||||
| 123 | Doniphan | 1,010 | 858 | 17.7% | |||||
| 124 | Loup City | 1,004 | 1,097 | -8.5% | |||||
