100 Biggest Cities In Utah For 2023
Using the latest Census data, we detail the 100 biggest cities in Utah. You can all see a comprehensive list of all 168 cities and places in Utah.

Article Table Of Contents
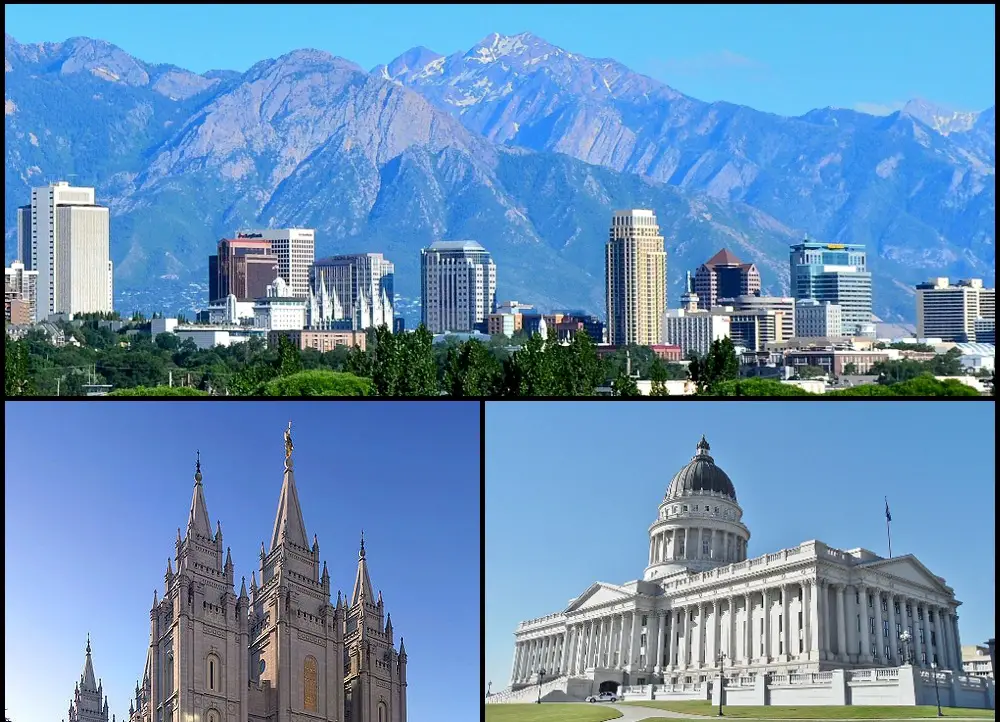
We all love the biggest cities that the Beehive State has to offer. You know the places like Salt Lake City and West Valley City which make all the headlines.
But there are a bunch of other great large cities in Utah that don't get as much love.
We're going to change that right now.
Using the most recent Census data, we can tell you about all the places in Utah with a focus on the biggest. We update the data each year and this is our fourth time doing this.
The Largest Cities In Utah For 2023:
You can click here to see a full table of the full of the 100 biggest cities in Utah, along with every other place over 1,000 people big. It is sortable by clicking on the headers.
Read on below to see more on the biggest cities. Or for more reading on places to live in Utah, check out:
The 10 Biggest Cities In Utah
/10
Rank Last Year: 1 (No Change)
Population: 200,133
Population 2010: 184,488
Growth: 8.5%
More on Salt Lake City: Crime Report | Homes For Sale | Data
/10
Rank Last Year: 2 (No Change)
Population: 135,610
Population 2010: 125,002
Growth: 8.5%
More on West Valley City: Homes For Sale | Data
/10
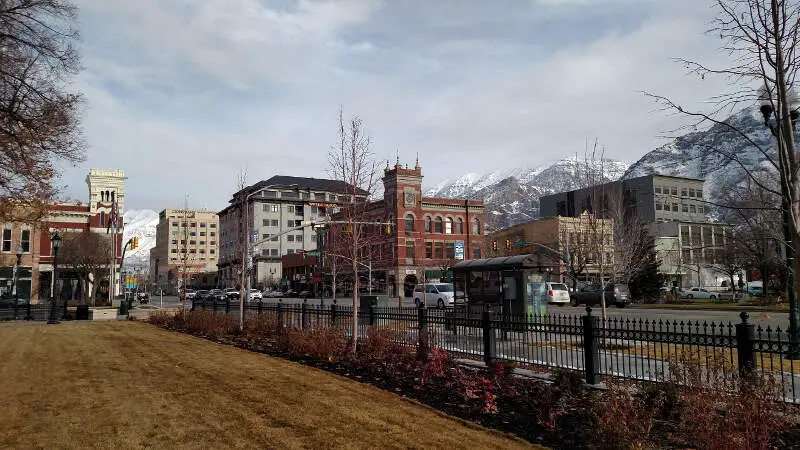
Rank Last Year: 3 (No Change)
Population: 116,886
Population 2010: 110,201
Growth: 6.1%
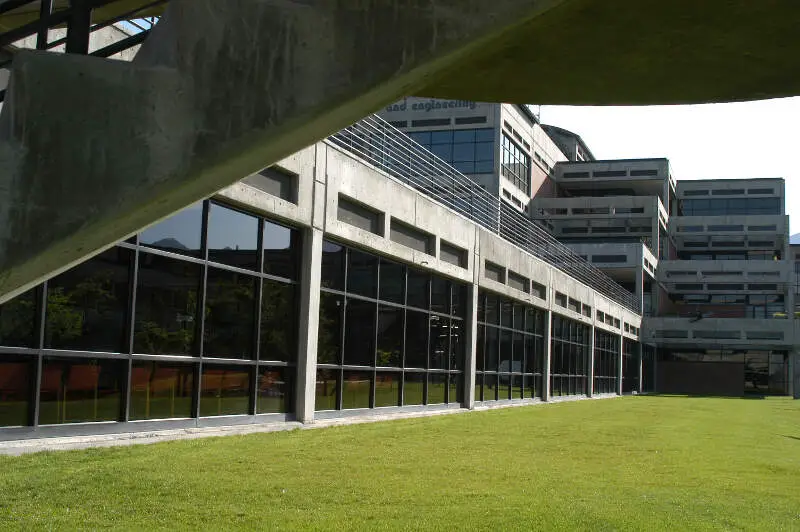
More on Provo: Crime Report | Homes For Sale | Data
/10
Rank Last Year: 4 (No Change)
Population: 115,181
Population 2010: 98,622
Growth: 16.8%
More on West Jordan: Crime Report | Homes For Sale | Data
/10
Rank Last Year: 5 (No Change)
Population: 97,883
Population 2010: 86,849
Growth: 12.7%
More on Orem: Crime Report | Homes For Sale | Data
/10
Rank Last Year: 6 (No Change)
Population: 96,137
Population 2010: 87,168
Growth: 10.3%
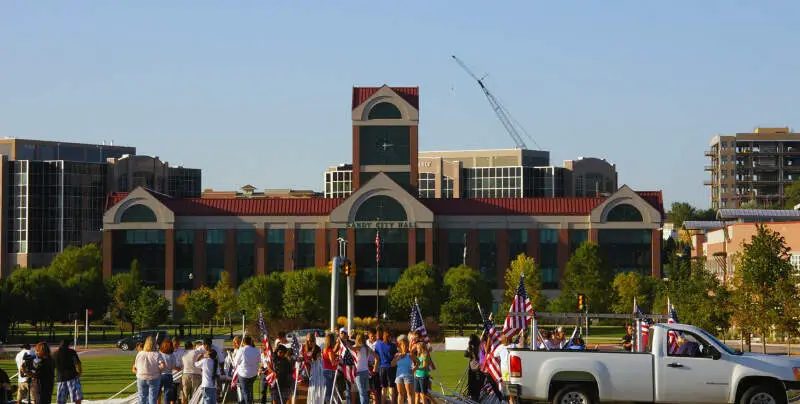
More on Sandy: Crime Report | Homes For Sale | Data
/10
Rank Last Year: 8 (Up 1)
Population: 87,176
Population 2010: 71,136
Growth: 22.5%
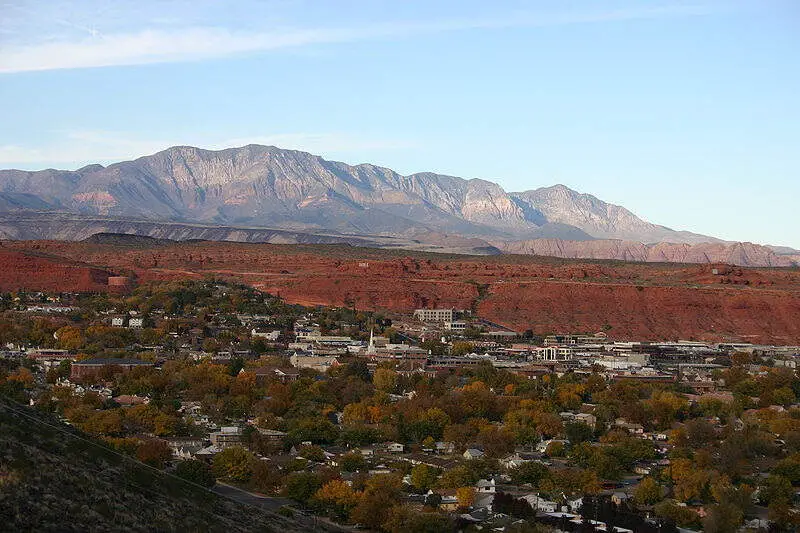
More on St. George: Crime Report | Homes For Sale | Data
/10
Rank Last Year: 7 (Down 1)
Population: 87,175
Population 2010: 81,054
Growth: 7.6%
More on Ogden: Crime Report | Homes For Sale | Data
/10
Rank Last Year: 9 (No Change)
Population: 77,268
Population 2010: 65,674
Growth: 17.7%
More on Layton: Crime Report | Homes For Sale | Data
/10
Rank Last Year: 12 (Up 2)
Population: 73,695
Population 2010: 46,366
Growth: 58.9%
More on South Jordan: Crime Report | Homes For Sale | Data
How We Determined The Largest Cities In Utah
We've been ranking and dissecting cities in the Beehive State for over 4 years now -- making this actually the fourth time we've run the numbers. We always use the best data, the US Census. In this case, that means we are using the 2013-2017 American Community Survey.
It what is probably the most simple analysis we run each year, we ranked every place in Utah from biggest to smallest. The biggest city this year? That would be Salt Lake City.
The smallest? Riverside, although there are places smaller than 1,000 people not listed here, so keep that in mind as we take a look at the top ten.
Now on to numbers 11-100 Biggest in Utah
We hope that you find the big city, or really any city, that's right for you. Below is a list of the rest of the biggest cities along with every other place in Utah.
Have fun snacking around in the Beehive State!
For more reading on Utah, check out:
- Best Places To Raise A Family In Utah
- Best Places To Retire In Utah
- Richest Cities In Utah
- Safest Places In Utah
- Worst Places To Live In Utah
- Most Expensive Places To Live In Utah
Detailed List Of The Biggest Cities In Utah
| Rank | City | Current Population | 2010 | Growth | |||||
|---|---|---|---|---|---|---|---|---|---|
| 1 | Salt Lake City | 200,133 | 184,488 | 8.5% | |||||
| 2 | West Valley City | 135,610 | 125,002 | 8.5% | |||||
| 3 | Provo | 116,886 | 110,201 | 6.1% | |||||
| 4 | West Jordan | 115,181 | 98,622 | 16.8% | |||||
| 5 | Orem | 97,883 | 86,849 | 12.7% | |||||
| 6 | Sandy | 96,137 | 87,168 | 10.3% | |||||
| 7 | St. George | 87,176 | 71,136 | 22.5% | |||||
| 8 | Ogden | 87,175 | 81,054 | 7.6% | |||||
| 9 | Layton | 77,268 | 65,674 | 17.7% | |||||
| 10 | South Jordan | 73,695 | 46,366 | 58.9% | |||||
| 11 | Lehi | 66,980 | 42,047 | 59.3% | |||||
| 12 | Millcreek | 60,557 | 61,001 | -0.7% | |||||
| 13 | Taylorsville | 59,926 | 58,339 | 2.7% | |||||
| 14 | Logan | 51,266 | 46,408 | 10.5% | |||||
| 15 | Murray | 48,969 | 46,271 | 5.8% | |||||
| 16 | Draper | 48,594 | 39,252 | 23.8% | |||||
| 17 | Herriman | 45,211 | 18,328 | 146.7% | |||||
| 18 | Bountiful | 43,991 | 42,363 | 3.8% | |||||
| 19 | Riverton | 43,793 | 35,991 | 21.7% | |||||
| 20 | Spanish Fork | 40,069 | 31,851 | 25.8% | |||||
| 21 | Roy | 39,243 | 35,843 | 9.5% | |||||
| 22 | Pleasant Grove | 38,474 | 31,457 | 22.3% | |||||
| 23 | Kearns | 37,748 | 34,726 | 8.7% | |||||
| 24 | Eagle Mountain | 35,431 | 17,892 | 98.0% | |||||
| 25 | Tooele | 35,313 | 30,167 | 17.1% | |||||
| 26 | Cottonwood Heights | 33,865 | 33,544 | 1.0% | |||||
| 27 | Midvale | 33,708 | 27,609 | 22.1% | |||||
| 28 | Cedar City | 33,404 | 27,720 | 20.5% | |||||
| 29 | Springville | 33,251 | 27,633 | 20.3% | |||||
| 30 | Kaysville | 31,957 | 26,051 | 22.7% | |||||
| 31 | American Fork | 31,636 | 25,370 | 24.7% | |||||
| 32 | Clearfield | 31,622 | 29,510 | 7.2% | |||||
| 33 | Saratoga Springs | 31,273 | 14,696 | 112.8% | |||||
| 34 | Holladay | 30,461 | 26,299 | 15.8% | |||||
| 35 | Syracuse | 30,366 | 21,689 | 40.0% | |||||
| 36 | Washington | 28,192 | 17,406 | 62.0% | |||||
| 37 | Magna | 27,454 | 26,903 | 2.0% | |||||
| 38 | South Salt Lake | 25,125 | 23,228 | 8.2% | |||||
| 39 | Farmington | 24,439 | 17,188 | 42.2% | |||||
| 40 | Clinton | 22,191 | 19,031 | 16.6% | |||||
| 41 | North Salt Lake | 20,721 | 14,986 | 38.3% | |||||
| 42 | Payson | 20,181 | 17,187 | 17.4% | |||||
| 43 | North Ogden | 19,930 | 16,779 | 18.8% | |||||
| 44 | Brigham City | 19,336 | 17,639 | 9.6% | |||||
| 45 | Highland | 19,012 | 14,081 | 35.0% | |||||
| 46 | Hurricane | 18,112 | 13,232 | 36.9% | |||||
| 47 | Centerville | 17,527 | 15,216 | 15.2% | |||||
| 48 | South Ogden | 17,080 | 15,970 | 7.0% | |||||
| 49 | Heber | 16,362 | 10,765 | 52.0% | |||||
| 50 | West Haven | 15,003 | 9,058 | 65.6% | |||||
| 51 | Bluffdale | 14,802 | 7,043 | 110.2% | |||||
| 52 | Santaquin | 12,276 | 8,365 | 46.8% | |||||
| 53 | Smithfield | 11,670 | 8,957 | 30.3% | |||||
| 54 | Grantsville | 11,488 | 8,458 | 35.8% | |||||
| 55 | Woods Cross | 11,423 | 9,166 | 24.6% | |||||
| 56 | Lindon | 11,072 | 9,698 | 14.2% | |||||
| 57 | North Logan | 10,978 | 7,765 | 41.4% | |||||
| 58 | West Point | 10,829 | 8,910 | 21.5% | |||||
| 59 | Alpine | 10,509 | 9,061 | 16.0% | |||||
| 60 | Pleasant View | 10,460 | 7,481 | 39.8% | |||||
| 61 | Vernal | 10,449 | 8,768 | 19.2% | |||||
| 62 | Mapleton | 10,270 | 7,543 | 36.2% | |||||
| 63 | Cedar Hills | 10,190 | 8,567 | 18.9% | |||||
| 64 | Stansbury Park | 9,271 | 5,347 | 73.4% | |||||
| 65 | Washington Terrace | 9,181 | 8,917 | 3.0% | |||||
| 66 | Ivins | 8,931 | 6,590 | 35.5% | |||||
| 67 | Tremonton | 8,890 | 7,219 | 23.1% | |||||
| 68 | Hooper | 8,850 | 6,590 | 34.3% | |||||
| 69 | Riverdale | 8,826 | 8,189 | 7.8% | |||||
| 70 | Vineyard | 8,628 | 192 | 4393.8% | |||||
| 71 | Park City | 8,467 | 7,553 | 12.1% | |||||
| 72 | Hyrum | 8,415 | 7,284 | 15.5% | |||||
| 73 | Salem | 8,403 | 6,060 | 38.7% | |||||
| 74 | Price | 8,303 | 8,473 | -2.0% | |||||
| 75 | Summit Park | 8,177 | 7,504 | 9.0% | |||||
| 76 | Santa Clara | 7,868 | 5,967 | 31.9% | |||||
| 77 | Richfield | 7,813 | 7,437 | 5.1% | |||||
| 78 | Providence | 7,732 | 6,502 | 18.9% | |||||
| 79 | South Weber | 7,631 | 5,707 | 33.7% | |||||
| 80 | Ephraim | 7,222 | 5,789 | 24.8% | |||||
| 81 | Farr West | 7,197 | 5,351 | 34.5% | |||||
| 82 | Plain City | 7,159 | 5,127 | 39.6% | |||||
| 83 | Roosevelt | 7,077 | 5,598 | 26.4% | |||||
| 84 | Enoch | 7,044 | 5,464 | 28.9% | |||||
| 85 | Nibley | 6,993 | 4,763 | 46.8% | |||||
| 86 | Harrisville | 6,637 | 5,176 | 28.2% | |||||
| 87 | Fruit Heights | 6,205 | 4,943 | 25.5% | |||||
| 88 | Nephi | 6,168 | 5,256 | 17.4% | |||||
| 89 | Snyderville | 5,995 | 5,248 | 14.2% | |||||
| 90 | West Bountiful | 5,724 | 5,140 | 11.4% | |||||
| 91 | White City | 5,527 | 4,667 | 18.4% | |||||
| 92 | Sunset | 5,309 | 5,129 | 3.5% | |||||
| 93 | Moab | 5,303 | 4,950 | 7.1% | |||||
| 94 | Midway | 5,210 | 3,606 | 44.5% | |||||
| 95 | Perry | 5,090 | 4,095 | 24.3% | |||||
| 96 | Kanab | 4,767 | 4,156 | 14.7% | |||||
| 97 | Hyde Park | 4,703 | 3,623 | 29.8% | |||||
| 98 | La Verkin | 4,383 | 4,087 | 7.2% | |||||
| 99 | Morgan | 4,259 | 3,495 | 21.9% | |||||
| 100 | Maeser | 4,064 | 3,806 | 6.8% | |||||
| 101 | Elk Ridge | 3,994 | 2,180 | 83.2% | |||||
| 102 | Wellsville | 3,847 | 3,265 | 17.8% | |||||
| 103 | Mountain Green | 3,694 | 1,819 | 103.1% | |||||
| 104 | Manti | 3,671 | 3,209 | 14.4% | |||||
| 105 | Delta | 3,604 | 3,330 | 8.2% | |||||
| 106 | Blanding | 3,594 | 3,276 | 9.7% | |||||
| 107 | Naples | 3,512 | 1,613 | 117.7% | |||||
| 108 | Gunnison | 3,511 | 3,094 | 13.5% | |||||
| 109 | Mount Pleasant | 3,471 | 3,140 | 10.5% | |||||
| 110 | Beaver | 3,115 | 2,985 | 4.4% | |||||
| 111 | Parowan | 3,104 | 2,793 | 11.1% | |||||
| 112 | Erda | 3,071 | 4,445 | -30.9% | |||||
| 113 | Hildale | 2,921 | 2,660 | 9.8% | |||||
| 114 | Richmond | 2,733 | 2,640 | 3.5% | |||||
| 115 | Salina | 2,603 | 2,630 | -1.0% | |||||
| 116 | Kamas | 2,591 | 1,861 | 39.2% | |||||
| 117 | Fillmore | 2,585 | 2,427 | 6.5% | |||||
| 118 | Monticello | 2,570 | 2,639 | -2.6% | |||||
| 119 | Garland | 2,554 | 2,207 | 15.7% | |||||
| 120 | Helper | 2,346 | 2,161 | 8.6% | |||||
| 121 | Monroe | 2,322 | 2,509 | -7.5% | |||||
| 122 | Huntington | 2,131 | 2,262 | -5.8% | |||||
| 123 | Lewiston | 2,091 | 1,740 | 20.2% | |||||
| 124 | Coalville | 2,066 | 1,792 | 15.3% | |||||
| 125 | Wolf Creek | 2,027 | 957 | 111.8% | |||||
| 126 | Duchesne | 2,019 | 1,704 | 18.5% | |||||
| 127 | River Heights | 1,980 | 1,863 | 6.3% | |||||
| 128 | Millville | 1,895 | 1,475 | 28.5% | |||||
| 129 | Marriott-Slaterville | 1,862 | 1,443 | 29.0% | |||||
| 130 | Emigration Canyon | 1,828 | 1,370 | 33.4% | |||||
| 131 | Milford | 1,827 | 1,715 | 6.5% | |||||
| 132 | Benson | 1,793 | 1,445 | 24.1% | |||||
| 133 | Panguitch | 1,718 | 1,789 | -4.0% | |||||
| 134 | Mona | 1,699 | 1,091 | 55.7% | |||||
| 135 | Toquerville | 1,689 | 0 | nan% | |||||
| 136 | Willard | 1,688 | 1,720 | -1.9% | |||||
| 137 | Honeyville | 1,651 | 1,224 | 34.9% | |||||
| 138 | Enterprise | 1,602 | 1,433 | 11.8% | |||||
| 139 | Genola | 1,601 | 1,168 | 37.1% | |||||
| 140 | Oakley | 1,600 | 1,319 | 21.3% | |||||
| 141 | Uintah | 1,562 | 1,535 | 1.8% | |||||
| 142 | Centerfield | 1,531 | 1,261 | 21.4% | |||||
| 143 | South Willard | 1,519 | 1,555 | -2.3% | |||||
| 144 | Ballard | 1,508 | 559 | 169.8% | |||||
| 145 | Wellington | 1,501 | 1,657 | -9.4% | |||||
| 146 | Ferron | 1,475 | 1,523 | -3.2% | |||||
| 147 | Fairview | 1,438 | 1,212 | 18.6% | |||||
| 148 | Woodland Hills | 1,422 | 1,317 | 8.0% | |||||
| 149 | Moroni | 1,405 | 1,202 | 16.9% | |||||
| 150 | Castle Dale | 1,380 | 1,653 | -16.5% | |||||
| 151 | West Mountain | 1,370 | 713 | 92.1% | |||||
| 152 | Francis | 1,364 | 1,217 | 12.1% | |||||
| 153 | Elwood | 1,354 | 913 | 48.3% | |||||
| 154 | Mendon | 1,342 | 1,246 | 7.7% | |||||
| 155 | Wendover | 1,258 | 1,275 | -1.3% | |||||
| 156 | Silver Summit | 1,256 | 2,934 | -57.2% | |||||
| 157 | Orangeville | 1,253 | 1,457 | -14.0% | |||||
| 158 | Carbonville | 1,170 | 1,459 | -19.8% | |||||
| 159 | Daniel | 1,147 | 1,104 | 3.9% | |||||
| 160 | Fountain Green | 1,140 | 880 | 29.5% | |||||
| 161 | Spring Glen | 1,126 | 942 | 19.5% | |||||
| 162 | Stockton | 1,072 | 540 | 98.5% | |||||
| 163 | Rocky Ridge | 1,069 | 751 | 42.3% | |||||
| 164 | Copperton | 1,041 | 708 | 47.0% | |||||
| 165 | Spring City | 1,027 | 1,224 | -16.1% | |||||
| 166 | Lake Shore | 1,020 | 652 | 56.4% | |||||
| 167 | Mantua | 1,017 | 689 | 47.6% | |||||
| 168 | Riverside | 1,010 | 628 | 60.8% | |||||