Michigan is always looking out for the safety of its residents. Michiganders created "yooper scoopers" to help people safely shovel snow from their roofs. They've trained their deer to fall down in front of their hunters so they don't have to take the safety off their guns, and they've removed the fish with teeth from Lake Michigan so you can swim safely.
If that doesn't say safe, we're not sure what does.
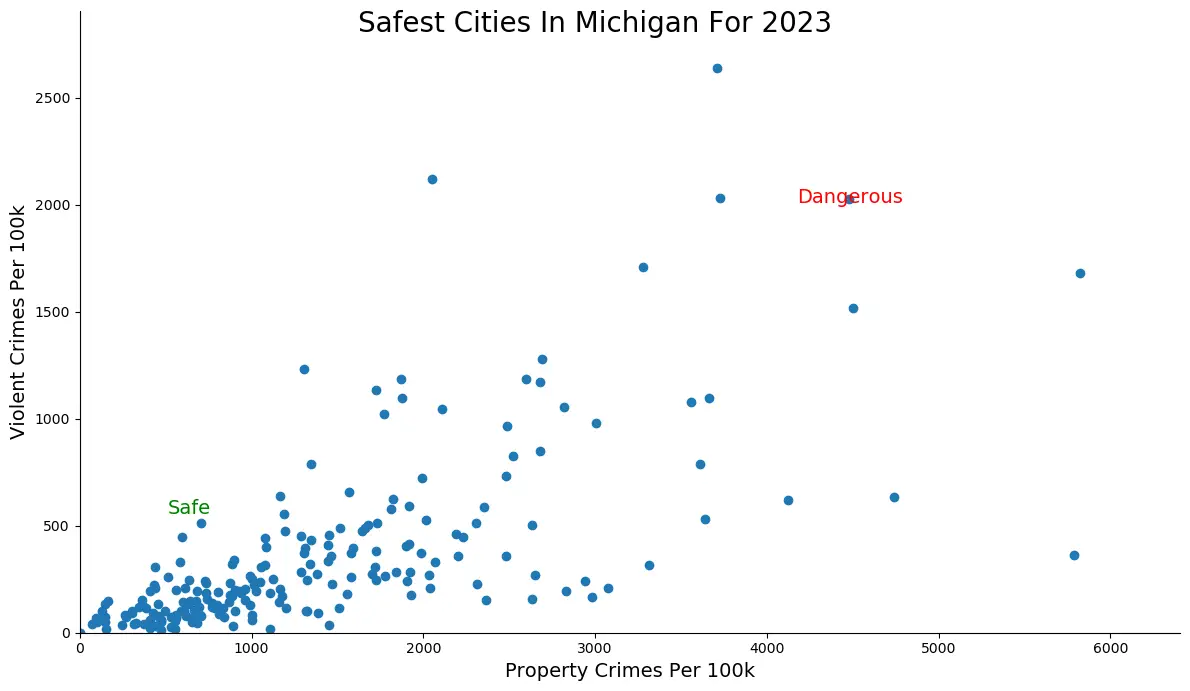
We wanted to know where, exactly, are the safest cities in Michigan. So, we consulted the numbers and analyzed 195 cities with over 5,000 residents. We looked at property and violent crimes per capita for every place from Detroit to Allegan.
We recommend that before you start a citywide "safety first" campaign, stop, drop, roll, and safely scroll down to see where the Michigan city you call home is placed on our list.
0 violent / 32 property per 100k
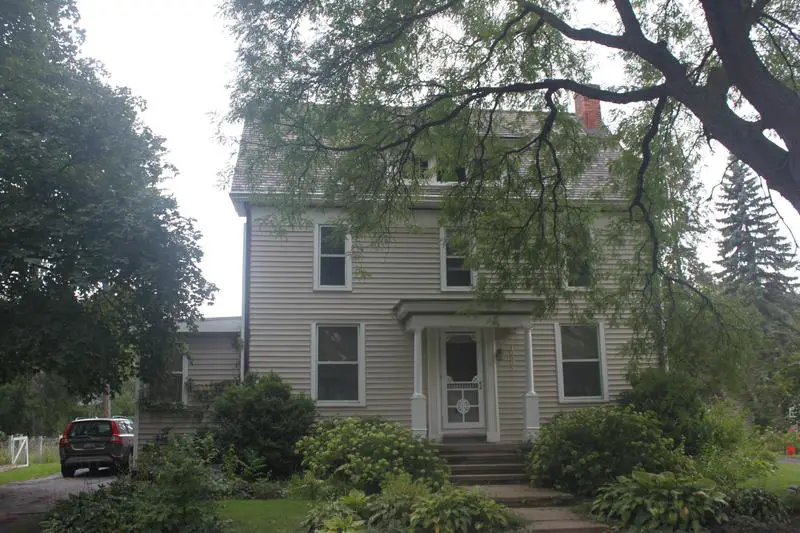
Addison, founded in 1834 and located on Bean Creek in Lenawee County, combines historic growth from the railroad era with a community-focused identity to rank as the safest village in the state.
With a population exceeding 6000, the village boasts very low crime rates, including a 0/100k people for violent crime and an equally impressive 32/100k people for property crimes. Its negligible 0 violent crime and 2 property crime incidents, coupled with no occurrences of murder, further cement Addison's status as secure for its citizens.

15 violent / 62 property per 100k
In Chippewa County, Kinross stands as Michigan's second safest city, boasting only 1 violent crimes and a mere 4 property offenses. The township's legacy of safety is upheld by its historic institutions like the township hall and school, contributing to a low violent crimeper capita rate. The community's overall 77/100k people crimes per capita is significantly below national averages, securing its #2 and #2 rankings in violent and property crime rates statewide.

30 violent / 172 property per 100k
Located in Oakland County, known for its prosperous development and affluent communities, Oakland ranks as the third safest city in Michigan for 2026. With a 29/100k people rate for violent crime, it sits at ninth safest statewide, and its property crime rate of 172/100k people earns it the fifth safest spot. The city's impressive safety record persists despite its sizeable population of 20,306 and dates back to its establishment in 1819. Remarkably, Oakland reported 0 murder cases this year.

19 violent / 243 property per 100k
Grosse Ile stands out for its safety, securing the fourth spot on the state's safest places list. This Wayne County civil township, with a history dating back to French explorers in 1679, boasts basically no cases of murder, rape, or robbery.
With only 2 viilent and 25 property crimes amidst a population of 10,296, Grosse Ile has some of the lowest rates of crime in the state.

27 violent / 268 property per 100k

38 violent / 184 property per 100k
32 violent / 305 property per 100k
Slap a fluorescent orange safety jacket on this little village in southeastern Oakland County and call them safe.
The residents of our seventh safest city in Michigan, Huntington Woods, say their little village packs a big punch--not literally, though, because it's super safe. Huntington Woods is a family friendly, safe D-town burb with convenient restaurants and stores. It's a great place to raise a family. And word on the street is that they have a home for everyone.
If you don't like people peeping through your windows, you don't have to worry because there's plenty of privacy in Huntington Woods. And if you love nature, it can be found as close as your backyard. There is a reason it's called Huntington Woods.
Data | Crime | Cost of living | Movers
24 violent / 378 property per 100k
Whether you go for the soft cider at Goodison Cider Mill or the harder stuff at Fieldstone, your chances of getting involved in a shady situation are equally likely in Rochester. Rochester had the 22nd safest rate of property crime in Michigan, with about six times fewer robberies going down than your average American city. And there were only eight violent crimes committed there in the last year of available data -- not too shabby for a city of over 13,000.
Rochester is part of the northern Detroit Metropolitan Area.
Data | Crime | Cost of living | Movers
57 violent / 115 property per 100k
34 violent / 343 property per 100k
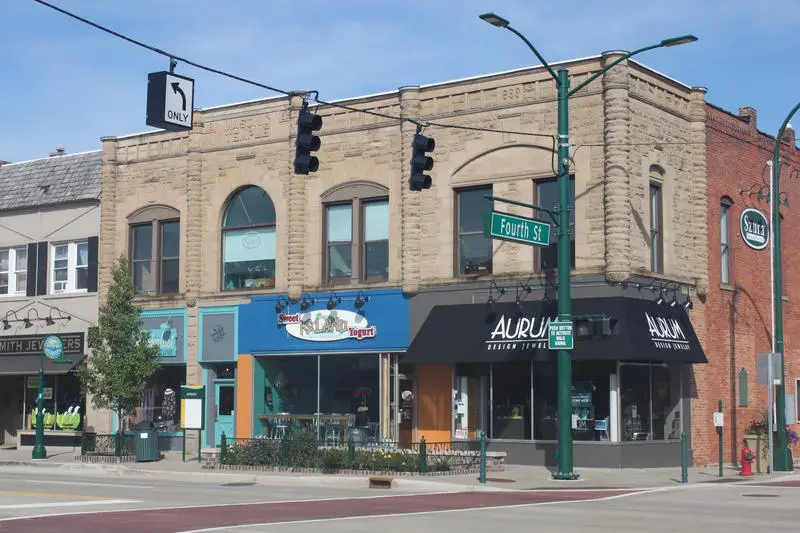
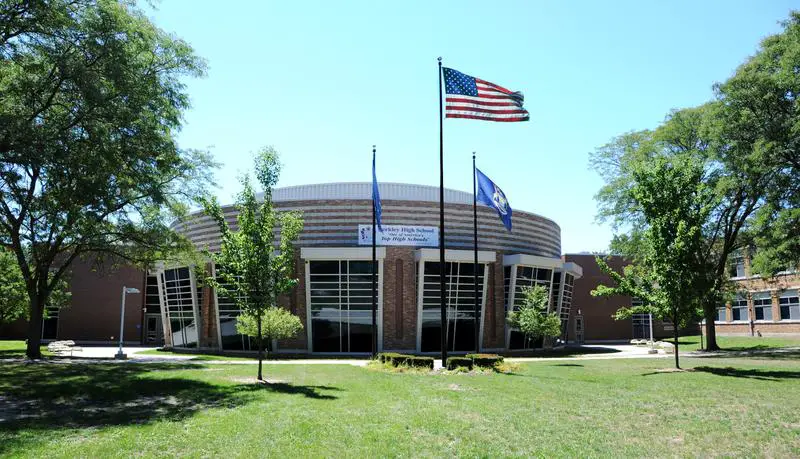
Berkley scored a perfect 10/10 on our snackability chart to become our tenth safest city in Michigan. This is the quintessential little village located on "the mitten's" thumb. Not surprising, they received a 9/10 safety score and a 9/10 education score. Safe and smart! Nice work Berkley!
In Berkley they also love to celebrate their long summer nights with safe, family friendly, festivals like their Art Bash, Summerfest, and the annual car show to name a few. nothing says safe like a community that creates opportunities to get to know anything and everything about each other. Just make sure you recycle properly because someone is always watching and you wouldn't want to become the talk of Oakland County.
Data | Crime | Cost of living | Movers
The receipts
Compare the top ten
Pick a metric. The bars rescale. The red line is Michigan's statewide median. Lower is safer.
Michigan statewide median: 211
Michigan statewide median: 973
Michigan statewide median: 0
On the map
Where the safety is in Michigan
Saturday Night Science
Methodology: How we calculated the safest cities in Michigan for 2026
While there are surveys and public polls on what cities in Michigan are the safest, we wanted to rely on something other than speculation and opinion. Instead, we looked at the hard numbers from the FBI's most recent crime report in Michigan.
Specifically, we used Saturday Night Science to analyze the FBI's Uniform Crime Report, which summarizes the number of property and violent crimes in each city annually. We used two criteria:
- Violent crimes per capita (murders, assaults, rapes, armed robberies)
- Property crimes per capita (thefts, burglaries, motor vehicle thefts)
For example, there were 2 crimes committed in Addison, with a reported population of 6,218. That means the number of crimes per capita is 0.0003, which translates into a 1 in 3,109 chance of being the victim of a crime.
We only looked at Michigan cities that have populations of more than 5,000. This filter left us with 195 of the biggest cities in Michigan to rank.
We ranked each city for each criterion from 1 to 195 where 1 in any particular category is the safest.
Next, we averaged each place's two criteria to create a Safety Index. We crowned the place with the lowest overall Safety Score, "The Safest Place In Michigan," with any ties going to the bigger city.
The safest city in Michigan, based on our criteria, is Addison. The most dangerous city in Michigan? Benton, where residents had a 1 in 12 chance of being the victim of a crime.
This article has been update for 2026. This report marks our eleventh time ranking the safest places to live in Michigan. All the data comes from the FBI's Crime In The USA 2024 report.
Summary
Summary: The Safest Cities In The Wolverine State
Looking at the data, you can tell that Addison is as safe as they come in Michigan, according to science and data.
But as most Michigan residents would agree, almost every place here has its safe and not safe parts. So just make sure you're informed ahead of time.
The safest places in Michigan are .
For more reading, check out:
The full plate
Where Are The Safest Cities In Michigan For 2026?
Click any column to sort. All 195 ranked Michigan cities.
| Rank | City | Population | Violent / 100k | Property / 100k | Murders / 100k | Murders |
|---|---|---|---|---|---|---|
| 1 | Addison, MI | 6,218 | 0 | 32 | 0 | 0 |
| 2 | Kinross, MI | 6,490 | 15 | 61 | 0 | 0 |
| 3 | Oakland, MI | 20,306 | 29 | 172 | 0 | 0 |
| 4 | Grosse Ile, MI | 10,296 | 19 | 242 | 0 | 0 |
| 5 | Lyon, MI | 26,094 | 26 | 268 | 0 | 0 |
| 6 | Hamburg, MI | 21,143 | 37 | 184 | 0 | 0 |
| 7 | Huntington Woods, MI | 6,225 | 32 | 305 | 0 | 0 |
| 8 | Rochester, MI | 12,706 | 23 | 377 | 0 | 0 |
| 9 | Argentine, MI | 6,965 | 57 | 114 | 0 | 0 |
| 10 | Berkley, MI | 14,859 | 33 | 343 | 0 | 0 |
| 11 | Springfield, MI | 14,762 | 27 | 392 | 0 | 0 |
| 12 | Milford, MI | 16,974 | 47 | 282 | 0 | 0 |
| 13 | Brandon, MI | 15,308 | 65 | 169 | 0 | 0 |
| 14 | South Lyon, MI | 12,010 | 58 | 291 | 0 | 0 |
| 15 | Napoleon, MI | 6,683 | 29 | 448 | 0 | 0 |
| 16 | Orion, MI | 35,833 | 36 | 404 | 0 | 0 |
| 17 | Oxford, MI | 19,165 | 83 | 213 | 5 | 1 |
| 18 | New Baltimore, MI | 11,961 | 41 | 401 | 0 | 0 |
| 19 | Green Oak, MI | 20,129 | 44 | 402 | 0 | 0 |
| 20 | White Lake, MI | 31,222 | 41 | 435 | 0 | 0 |
| 21 | Gladstone, MI | 5,232 | 38 | 477 | 0 | 0 |
| 22 | Trenton, MI | 17,698 | 33 | 542 | 5 | 1 |
| 23 | Bloomfield, MI | 43,611 | 36 | 541 | 0 | 0 |
| 24 | Beverly Hills, MI | 10,332 | 48 | 493 | 0 | 0 |
| 25 | Tittabawassee, MI | 10,947 | 91 | 328 | 0 | 0 |
| 26 | Forsyth, MI | 6,292 | 79 | 397 | 0 | 0 |
| 27 | Northville, MI | 5,932 | 16 | 606 | 0 | 0 |
| 28 | Farmington, MI | 11,334 | 88 | 352 | 0 | 0 |
| 29 | Raisin, MI | 8,038 | 87 | 385 | 0 | 0 |
| 30 | St. Clair, MI | 6,019 | 66 | 448 | 0 | 0 |
| 31 | Independence, MI | 37,059 | 102 | 323 | 0 | 0 |
| 32 | Montrose, MI | 7,605 | 65 | 473 | 0 | 0 |
| 33 | Clayton, MI | 7,234 | 124 | 221 | 0 | 0 |
| 34 | Tecumseh, MI | 8,571 | 116 | 338 | 0 | 0 |
| 35 | West Bloomfield, MI | 64,892 | 81 | 525 | 0 | 0 |
| 36 | Highland, MI | 19,047 | 136 | 288 | 0 | 0 |
| 37 | Spring Arbor, MI | 8,501 | 129 | 352 | 0 | 0 |
| 38 | Northfield, MI | 8,461 | 70 | 555 | 11 | 1 |
| 39 | Rochester Hills, MI | 75,960 | 92 | 531 | 1 | 1 |
| 40 | Allegan, MI | 5,144 | 58 | 602 | 0 | 0 |
| 41 | Birmingham, MI | 21,326 | 56 | 642 | 0 | 0 |
| 42 | Flushing, MI | 8,192 | 73 | 561 | 0 | 0 |
| 43 | Houghton, MI | 8,564 | 35 | 758 | 0 | 0 |
| 44 | Commerce, MI | 39,076 | 61 | 614 | 0 | 0 |
| 45 | Holly, MI | 5,922 | 84 | 557 | 0 | 0 |
| 46 | Zeeland, MI | 5,621 | 88 | 551 | 0 | 0 |
| 47 | Richmond, MI | 5,820 | 85 | 601 | 0 | 0 |
| 48 | Chocolay, MI | 6,022 | 215 | 215 | 0 | 0 |
| 49 | Marysville, MI | 9,893 | 151 | 515 | 0 | 0 |
| 50 | Berrien Springs-Oronoko, MI | 9,008 | 133 | 543 | 0 | 0 |
| 51 | Novi, MI | 66,366 | 99 | 655 | 1 | 1 |
| 52 | Howell, MI | 9,985 | 110 | 640 | 10 | 1 |
| 53 | Petoskey, MI | 5,839 | 119 | 565 | 0 | 0 |
| 54 | St. Johns, MI | 7,699 | 168 | 519 | 0 | 0 |
| 55 | Plymouth, MI | 9,095 | 54 | 967 | 0 | 0 |
| 56 | Shelby, MI | 79,985 | 160 | 542 | 0 | 0 |
| 57 | Marquette, MI | 21,245 | 188 | 508 | 0 | 0 |
| 58 | Grosse Pointe Farms, MI | 9,640 | 41 | 1,068 | 0 | 0 |
| 59 | Midland, MI | 42,712 | 121 | 655 | 2 | 1 |
| 60 | Milan, MI | 5,990 | 100 | 767 | 0 | 0 |
| 61 | St. Louis, MI | 7,014 | 185 | 541 | 0 | 0 |
| 62 | Rockford, MI | 6,183 | 97 | 792 | 0 | 0 |
| 63 | Hampton, MI | 9,531 | 115 | 713 | 0 | 0 |
| 64 | Ionia, MI | 11,900 | 184 | 554 | 0 | 0 |
| 65 | East Grand Rapids, MI | 11,441 | 61 | 1,083 | 0 | 0 |
| 66 | Grosse Pointe Park, MI | 10,982 | 18 | 1,566 | 0 | 0 |
| 67 | Ontwa-Edwardsburg, MI | 6,821 | 146 | 703 | 0 | 0 |
| 68 | Brownstown, MI | 32,439 | 151 | 690 | 0 | 0 |
| 69 | Huron, MI | 16,648 | 234 | 498 | 0 | 0 |
| 70 | Clawson, MI | 11,114 | 197 | 557 | 0 | 0 |
| 71 | Royal Oak, MI | 57,257 | 124 | 801 | 0 | 0 |
| 72 | Oscoda, MI | 7,211 | 277 | 402 | 27 | 2 |
| 73 | Walled Lake, MI | 7,321 | 136 | 805 | 0 | 0 |
| 74 | Grand Blanc, MI | 7,876 | 165 | 736 | 0 | 0 |
| 75 | Chelsea, MI | 5,335 | 149 | 787 | 0 | 0 |
| 76 | Grand Ledge, MI | 7,781 | 282 | 424 | 0 | 0 |
| 77 | Lincoln, MI | 14,864 | 141 | 840 | 0 | 0 |
| 78 | Mason, MI | 8,114 | 160 | 776 | 0 | 0 |
| 79 | Farmington Hills, MI | 82,116 | 198 | 680 | 1 | 1 |
| 80 | Chesterfield, MI | 45,674 | 113 | 1,046 | 0 | 0 |
| 81 | Dewitt, MI | 15,433 | 246 | 583 | 6 | 1 |
| 82 | Brighton, MI | 8,140 | 110 | 1,228 | 0 | 0 |
| 83 | Denton, MI | 5,430 | 165 | 939 | 0 | 0 |
| 84 | Frankenmuth, MI | 5,209 | 230 | 652 | 0 | 0 |
| 85 | Bath, MI | 13,473 | 215 | 712 | 7 | 1 |
| 86 | Grosse Pointe Woods, MI | 15,665 | 95 | 1,487 | 0 | 0 |
| 87 | Ishpeming, MI | 6,195 | 193 | 887 | 0 | 0 |
| 88 | Troy, MI | 87,422 | 115 | 1,276 | 0 | 0 |
| 89 | Wixom, MI | 17,120 | 181 | 969 | 5 | 1 |
| 90 | Davison, MI | 5,031 | 198 | 874 | 0 | 0 |
| 91 | Sumpter, MI | 9,449 | 275 | 677 | 0 | 0 |
| 92 | Canton, MI | 97,844 | 172 | 1,051 | 3 | 3 |
| 93 | Riverview, MI | 11,821 | 203 | 939 | 0 | 0 |
| 94 | Thomas, MI | 11,854 | 269 | 708 | 0 | 0 |
| 95 | Grand Haven, MI | 10,997 | 209 | 927 | 0 | 0 |
| 96 | Hillsdale, MI | 7,986 | 288 | 638 | 0 | 0 |
| 97 | Ludington, MI | 7,582 | 211 | 936 | 0 | 0 |
| 98 | Woodhaven, MI | 12,447 | 112 | 1,542 | 0 | 0 |
| 99 | Coloma, MI | 6,377 | 439 | 533 | 0 | 0 |
| 100 | Belding, MI | 5,981 | 351 | 601 | 0 | 0 |
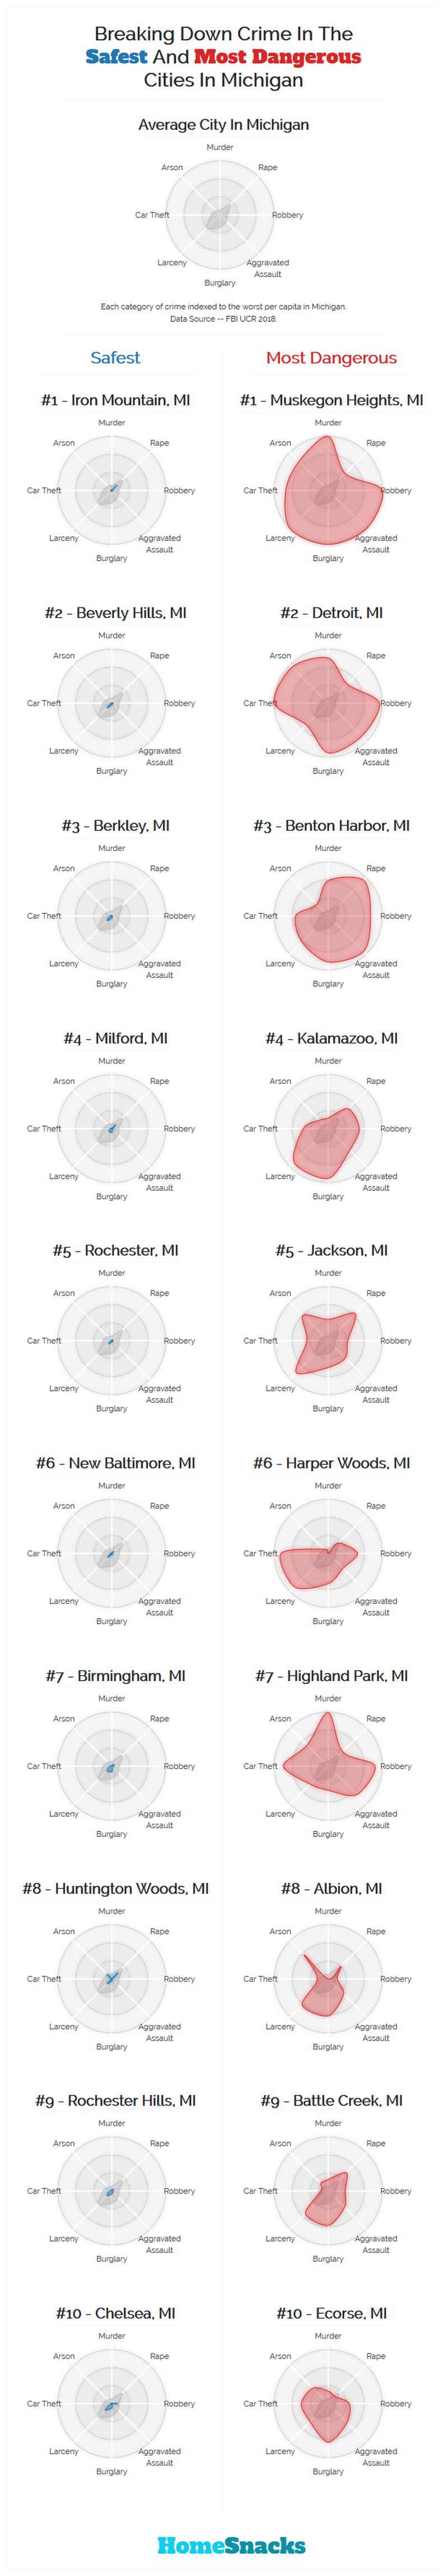
Breaking Down Crime In The Safest And Most Dangerous Cities In Michigan
Keep exploring