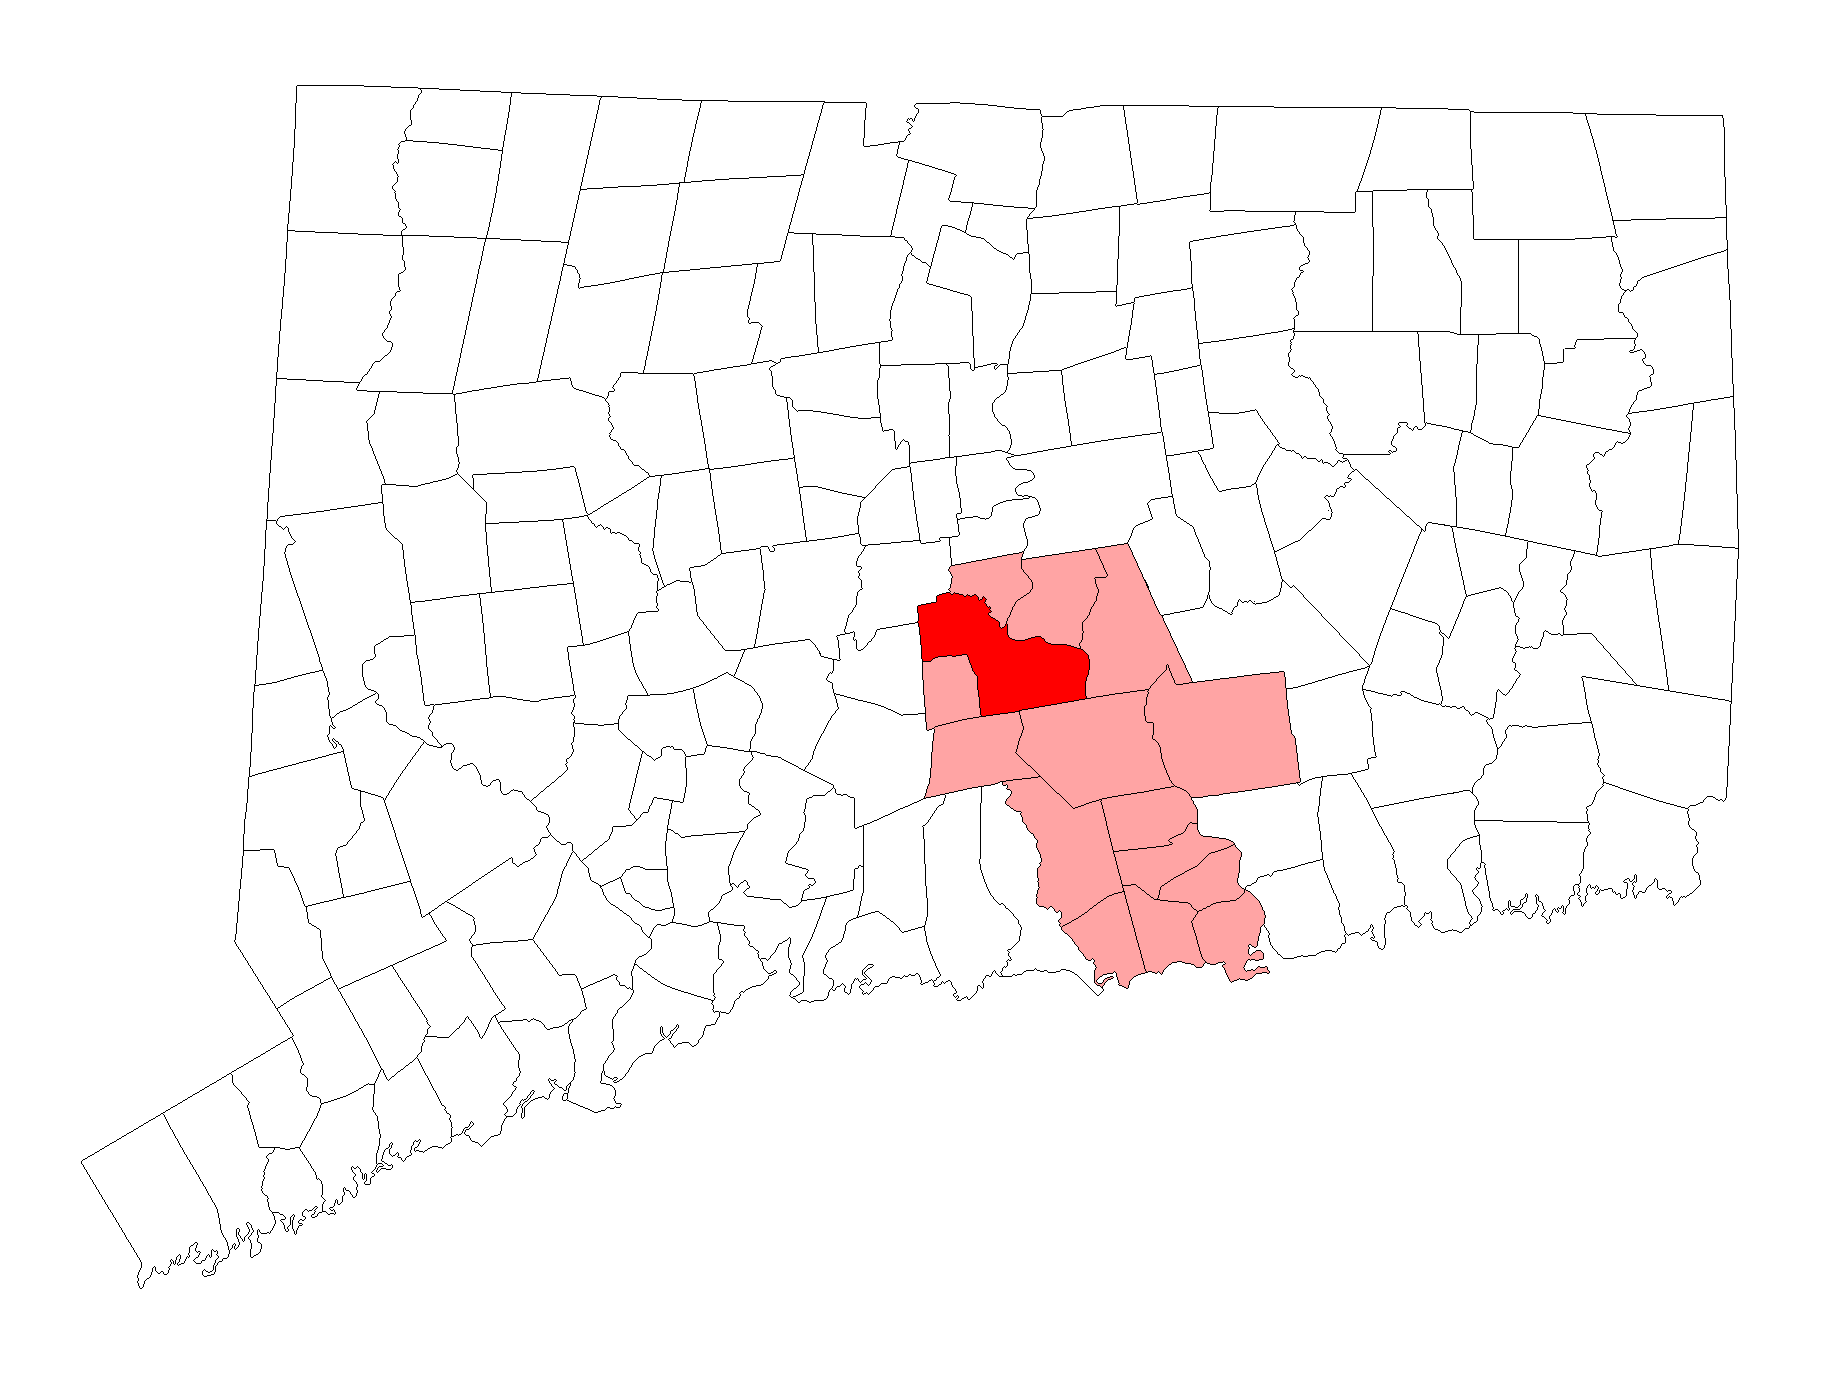
Life in Middlesex County research summary. HomeSnacks has been researching the quality of life in Middlesex County over the past eight years using Census data, FBI crime data, cost of living data, and other primary sources. Based on the most recently available data, we found the following about life in Middlesex County:
The population in Middlesex County is 164,568.
The median home value in Middlesex County is $298,300.
The median income in Middlesex County is $90,833.
The median rent in Middlesex County is $1,222.
The unemployment rate in Middlesex County is 4.7%.
The poverty rate in Middlesex County is 6.4%.

The current population in Middlesex County is 164,568. The population has increased 0.9% from 2019.
| Year | Population | % Change |
|---|---|---|
| 2021 | 164,568 | 1.1% |
| 2020 | 162,742 | -0.2% |
| 2019 | 163,053 | - |
Middlesex County is 50.8% female with 83,663 female residents.
Middlesex County is 49.2% male with 80,905 male residents.
| Gender | Middlesex County | CT | USA |
|---|---|---|---|
| Female | 50.8% | 51.2% | 50.5% |
| Male | 49.2% | 48.8% | 49.5% |
Middlesex County is:
84.3% White with 137,696 White residents.
4.9% African American with 8,050 African American residents.
0.1% American Indian with 118 American Indian residents.
3.0% Asian with 4,956 Asian residents.
0.0% Hawaiian with 0 Hawaiian residents.
0.1% Other with 140 Other residents.
1.6% Two Or More with 2,573 Two Or More residents.
6.0% Hispanic with 9,835 Hispanic residents.
| Race | Middlesex County | CT | USA |
|---|---|---|---|
| White | 84.3% | 64.9% | 59.4% |
| African American | 4.9% | 10.0% | 12.2% |
| American Indian | 0.1% | 0.1% | 0.6% |
| Asian | 3.0% | 4.6% | 5.6% |
| Hawaiian | 0.0% | 0.0% | 0.2% |
| Other | 0.1% | 0.5% | 0.4% |
| Two Or More | 1.6% | 2.9% | 3.2% |
| Hispanic | 6.0% | 16.9% | 18.4% |
3.6% of households in Middlesex County earn Less than $10,000.
2.7% of households in Middlesex County earn $10,000 to $14,999.
5.7% of households in Middlesex County earn $15,000 to $24,999.
6.3% of households in Middlesex County earn $25,000 to $34,999.
9.1% of households in Middlesex County earn $35,000 to $49,999.
15.1% of households in Middlesex County earn $50,000 to $74,999.
12.7% of households in Middlesex County earn $75,000 to $99,999.
19.4% of households in Middlesex County earn $100,000 to $149,999.
11.9% of households in Middlesex County earn $150,000 to $199,999.
13.7% of households in Middlesex County earn $200,000 or more.
| Income | Middlesex County | CT | USA |
|---|---|---|---|
| Less than $10,000 | 3.6% | 5.2% | 5.5% |
| $10,000 to $14,999 | 2.7% | 3.6% | 3.9% |
| $15,000 to $24,999 | 5.7% | 7.4% | 7.8% |
| $25,000 to $34,999 | 6.3% | 7.1% | 8.2% |
| $35,000 to $49,999 | 9.1% | 10.6% | 11.4% |
| $50,000 to $74,999 | 15.1% | 15.5% | 16.8% |
| $75,000 to $99,999 | 12.7% | 12.5% | 12.8% |
| $100,000 to $149,999 | 19.4% | 17.2% | 16.3% |
| $150,000 to $199,999 | 11.9% | 9.0% | 7.8% |
| $200,000 or more | 13.7% | 11.9% | 9.5% |
3.0% of adults in Middlesex County completed < 9th grade.
3.0% of adults in Middlesex County completed 9-12th grade.
25.0% of adults in Middlesex County completed high school / ged.
17.0% of adults in Middlesex County completed some college.
9.0% of adults in Middlesex County completed associate's degree.
24.0% of adults in Middlesex County completed bachelor's degree.
14.0% of adults in Middlesex County completed master's degree.
3.0% of adults in Middlesex County completed professional degree.
2.0% of adults in Middlesex County completed doctorate degree.
| Education | Middlesex County | CT | USA |
|---|---|---|---|
| < 9th Grade | 3% | 4% | 4% |
| 9-12th Grade | 3% | 5% | 6% |
| High School / GED | 25% | 27% | 26% |
| Some College | 17% | 17% | 20% |
| Associate's Degree | 9% | 8% | 9% |
| Bachelor's Degree | 24% | 22% | 21% |
| Master's Degree | 14% | 12% | 9% |
| Professional Degree | 3% | 3% | 2% |
| Doctorate Degree | 2% | 2% | 2% |
HomeSnacks is based in Durham, NC.
We aim to deliver bite-sized pieces of infotainment about where you live.
We use data, analytics, and a sense of humor to determine quality of life for places across the nation.