Baton Rouge, LA
Demographics And Statistics
Living In Baton Rouge, Louisiana Summary
Life in Baton Rouge research summary. HomeSnacks has been using Saturday Night Science to research the quality of life in Baton Rouge over the past nine years using Census, FBI, Zillow, and other primary data sources. Based on the most recently available data, we found the following about life in Baton Rouge:
The population in Baton Rouge is 225,500.
The median home value in Baton Rouge is $214,487.
The median income in Baton Rouge is $50,155.
The cost of living in Baton Rouge is 96 which is 1.0x lower than the national average.
The median rent in Baton Rouge is $1,010.
The unemployment rate in Baton Rouge is 8.6%.
The poverty rate in Baton Rouge is 24.0%.
The average high in Baton Rouge is 78.1° and the average low is 56.8°.
Baton Rouge SnackAbility
Overall SnackAbility
Baton Rouge, LA Crime Report
Crime in Baton Rouge summary. We use data from the FBI to determine the crime rates in Baton Rouge. Key points include:
There were 15,130 total crimes in Baton Rouge in the last reporting year.
The overall crime rate per 100,000 people in Baton Rouge is 6,880.0 / 100k people.
The violent crime rate per 100,000 people in Baton Rouge is 1,027.7 / 100k people.
The property crime rate per 100,000 people in Baton Rouge is 5,852.3 / 100k people.
Overall, crime in Baton Rouge is 196.02% above the national average.
Total Crimes
Above National Average
Crime In Baton Rouge Comparison Table
| Statistic | Count Raw |
Baton Rouge / 100k People |
Louisiana / 100k People |
National / 100k People |
|---|---|---|---|---|
| Total Crimes Per 100K | 15,130 | 6,880.0 | 3,523.8 | 2,324.2 |
| Violent Crime | 2,260 | 1,027.7 | 639.4 | 369.8 |
| Murder | 64 | 29.1 | 15.8 | 6.3 |
| Robbery | 340 | 154.6 | 80.7 | 66.1 |
| Aggravated Assault | 1,722 | 783.0 | 497.0 | 268.2 |
| Property Crime | 12,870 | 5,852.3 | 2,884.4 | 1,954.4 |
| Burglary | 3,109 | 1,413.7 | 510.1 | 269.8 |
| Larceny | 8,168 | 3,714.2 | 2,107.3 | 1,401.9 |
| Car Theft | 1,593 | 724.4 | 266.9 | 282.7 |
Baton Rouge, LA Cost Of Living
Cost of living in Baton Rouge summary. We use data on the cost of living to determine how expensive it is to live in Baton Rouge. Real estate prices drive most of the variance in cost of living around Louisiana. Key points include:
The cost of living in Baton Rouge is 96 with 100 being average.
The cost of living in Baton Rouge is 1.0x lower than the national average.
The median home value in Baton Rouge is $214,487.
The median income in Baton Rouge is $50,155.
Baton Rouge's Overall Cost Of Living
Lower Than The National Average
Cost Of Living In Baton Rouge Comparison Table
| Living Expense | Baton Rouge | Louisiana | National Average | |
|---|---|---|---|---|
| Overall | 96 | 92 | 100 | |
| Services | 105 | 96 | 100 | |
| Groceries | 101 | 96 | 100 | |
| Health | 96 | 99 | 100 | |
| Housing | 84 | 83 | 100 | |
| Transportation | 111 | 96 | 100 | |
| Utilities | 75 | 86 | 100 | |
Baton Rouge, LA Weather
The average high in Baton Rouge is 78.1° and the average low is 56.8°.
There are 79.3 days of precipitation each year.
Expect an average of 62.5 inches of precipitation each year with 0.1 inches of snow.
| Stat | Baton Rouge |
|---|---|
| Average Annual High | 78.1 |
| Average Annual Low | 56.8 |
| Annual Precipitation Days | 79.3 |
| Average Annual Precipitation | 62.5 |
| Average Annual Snowfall | 0.1 |
Average High
Days of Rain
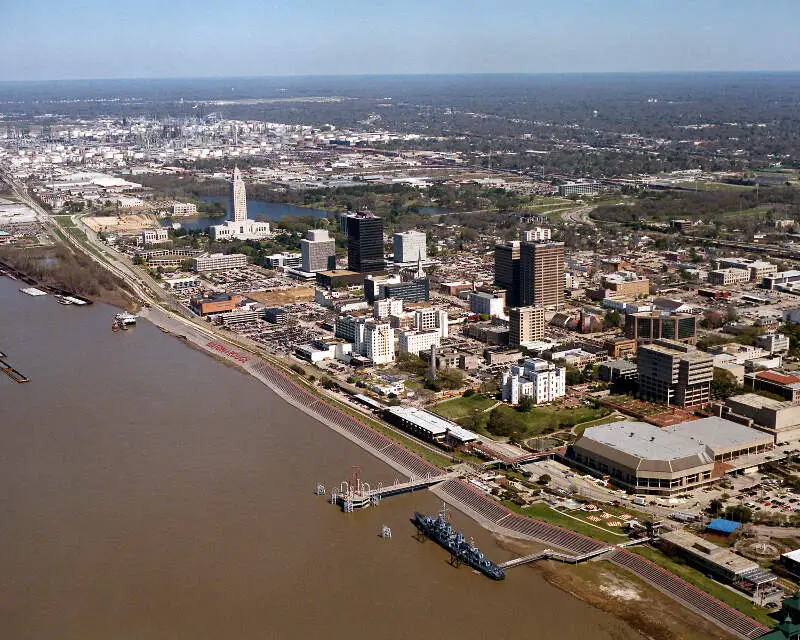
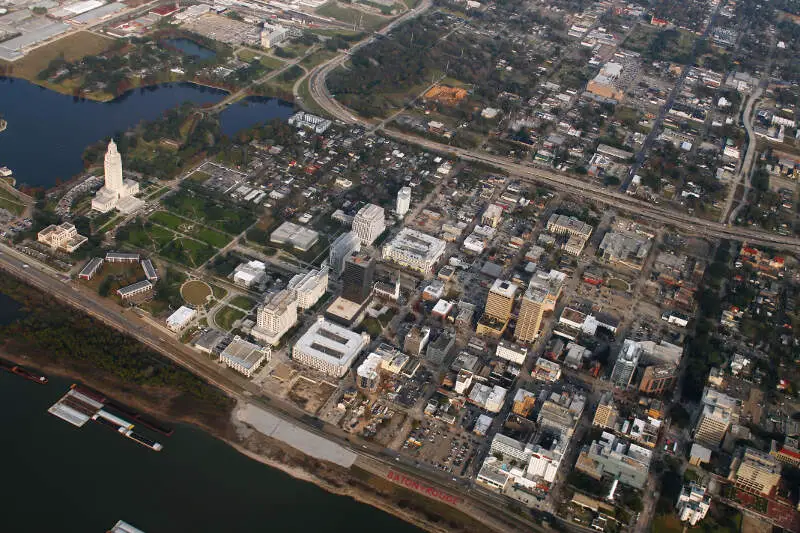
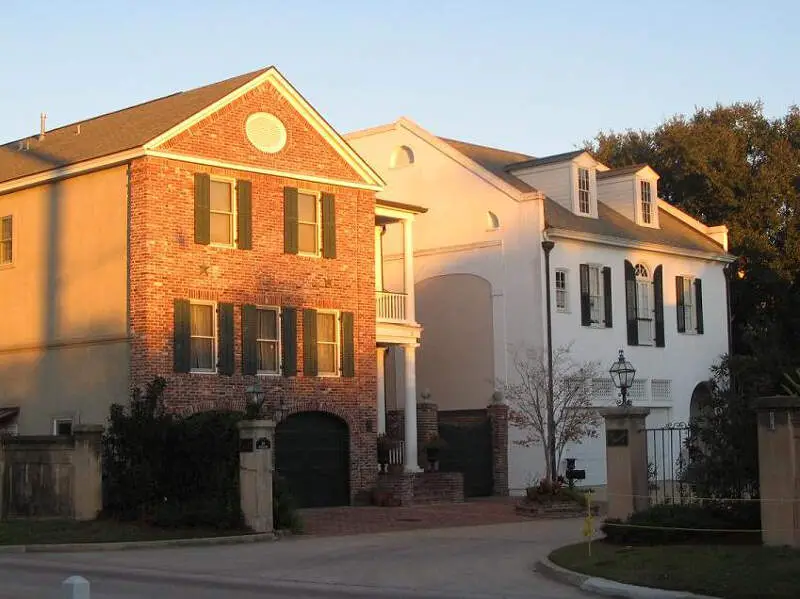
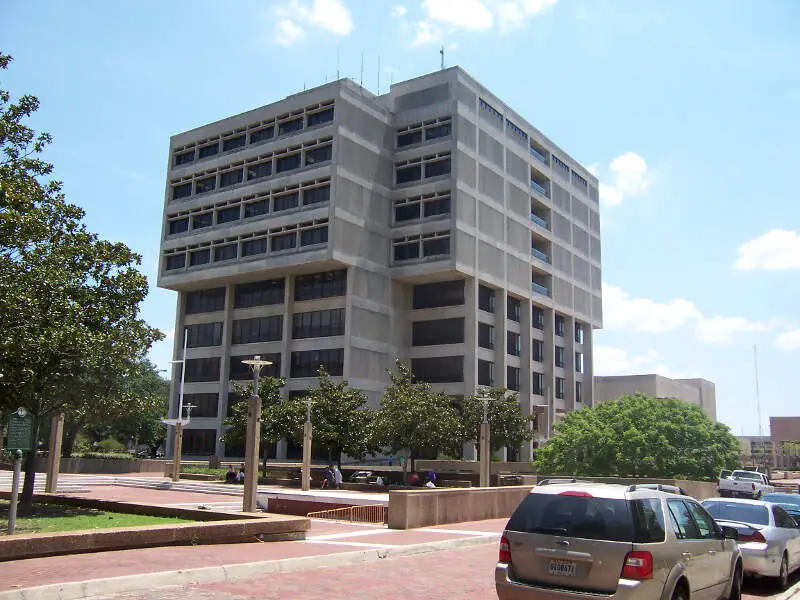
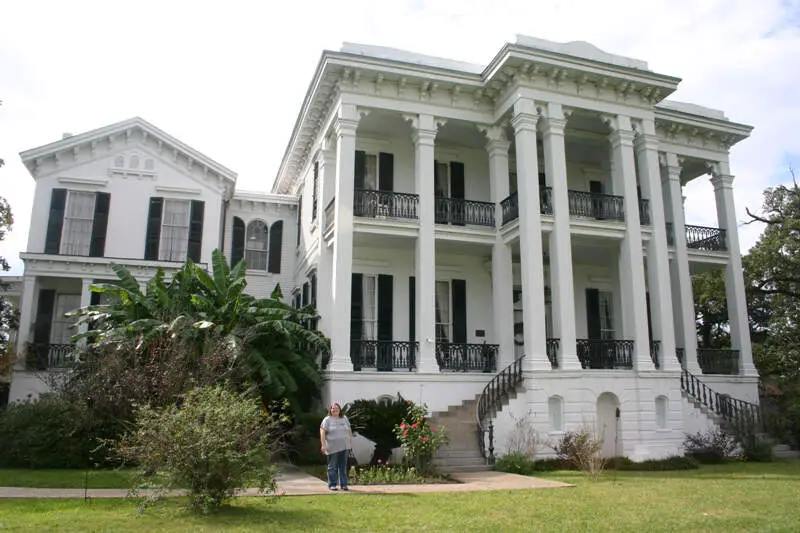
Baton Rouge, LA Photos




2 Reviews & Comments About Baton Rouge
/5


Dr. Vegas McD- -
I lived in Baton Rouge for 15 years and outer parts and looking at ' Seattle ' as where I am now looks good on a post card or tourist brochure but it,s a dumped site full of trash, p**s, feces 10,000 homeless nuts and about half of them are illegal immigrants and your info on towns in Louisiana is some what true and not true. I like the old homes and country living were I don,t have to look at inbred Homeless trash in Washington State and H****n addicts, Liberal nut cases and the anti Fa punks..., really this place was beautiful in 1980 but progressives moved here and brought the bums and nut cases here and actually can,t what to get back to Baton Rouge where people are 'REAL ' you smart a*s yuppie hipster d**k !

HomeSnacks User - 2018-08-05 10:52:15.214463
This is probably one of the worst cities I've ever been too. The traffic is awful and almost as bad as Los Angeles, which has something like 5 times the population. Most of the areas outside of the central business district live in poverty, the schools are way below the national average, and the food pales in comparison to New Orleans. I wouldn't recommend that anyone visit or move here.
The best part of Baton Rouge is that it is located pretty close to New Orleans, and is Louisiana's state capital. The thing that stood out the most is the horrid traffic and degrading infrastructure.
Baton Rouge Articles
Rankings for Baton Rouge in Louisiana
Locations Around Baton Rouge
Map Of Baton Rouge, LA
Best Places Around Baton Rouge
Baker, LA
Population 12,463
Merrydale, LA
Population 8,557
Central, LA
Population 29,518
Zachary, LA
Population 19,401
Gardere, LA
Population 11,565
Prairieville, LA
Population 34,215
Plaquemine, LA
Population 6,218
Oak Hills Place, LA
Population 8,813
St. Gabriel, LA
Population 6,526
Shenandoah, LA
Population 18,561
Baton Rouge Demographics And Statistics
Population over time in Baton Rouge
The current population in Baton Rouge is 225,500. The population has decreased -1.6% from 2010.
| Year | Population | % Change |
|---|---|---|
| 2022 | 225,500 | 0.1% |
| 2021 | 225,362 | -1.0% |
| 2020 | 227,549 | -0.5% |
| 2019 | 228,694 | -0.2% |
| 2018 | 229,186 | -0.1% |
| 2017 | 229,353 | -0.0% |
| 2016 | 229,400 | 0.1% |
| 2015 | 229,174 | 0.0% |
| 2014 | 229,169 | 0.0% |
| 2013 | 229,158 | - |
Race / Ethnicity in Baton Rouge
Baton Rouge is:
35.8% White with 80,681 White residents.
52.4% African American with 118,256 African American residents.
0.1% American Indian with 288 American Indian residents.
3.8% Asian with 8,601 Asian residents.
0.0% Hawaiian with 0 Hawaiian residents.
0.4% Other with 835 Other residents.
3.1% Two Or More with 6,983 Two Or More residents.
4.4% Hispanic with 9,856 Hispanic residents.
| Race | Baton Rouge | LA | USA |
|---|---|---|---|
| White | 35.8% | 57.5% | 58.9% |
| African American | 52.4% | 31.4% | 12.1% |
| American Indian | 0.1% | 0.4% | 0.6% |
| Asian | 3.8% | 1.7% | 5.7% |
| Hawaiian | 0.0% | 0.0% | 0.2% |
| Other | 0.4% | 0.4% | 0.4% |
| Two Or More | 3.1% | 3.0% | 3.5% |
| Hispanic | 4.4% | 5.5% | 18.7% |
Gender in Baton Rouge
Baton Rouge is 52.2% female with 117,700 female residents.
Baton Rouge is 47.8% male with 107,800 male residents.
| Gender | Baton Rouge | LA | USA |
|---|---|---|---|
| Female | 52.2% | 51.0% | 50.4% |
| Male | 47.8% | 49.0% | 49.6% |
Highest level of educational attainment in Baton Rouge for adults over 25
4.0% of adults in Baton Rouge completed < 9th grade.
8.0% of adults in Baton Rouge completed 9-12th grade.
26.0% of adults in Baton Rouge completed high school / ged.
20.0% of adults in Baton Rouge completed some college.
5.0% of adults in Baton Rouge completed associate's degree.
20.0% of adults in Baton Rouge completed bachelor's degree.
11.0% of adults in Baton Rouge completed master's degree.
3.0% of adults in Baton Rouge completed professional degree.
3.0% of adults in Baton Rouge completed doctorate degree.
| Education | Baton Rouge | LA | USA |
|---|---|---|---|
| < 9th Grade | 4.0% | 3.0% | 4.0% |
| 9-12th Grade | 8.0% | 9.0% | 6.0% |
| High School / GED | 26.0% | 33.0% | 26.0% |
| Some College | 20.0% | 21.0% | 20.0% |
| Associate's Degree | 5.0% | 7.0% | 9.0% |
| Bachelor's Degree | 20.0% | 17.0% | 21.0% |
| Master's Degree | 11.0% | 7.0% | 10.0% |
| Professional Degree | 3.0% | 2.0% | 2.0% |
| Doctorate Degree | 3.0% | 1.0% | 2.0% |
Household Income For Baton Rouge, Louisiana
9.5% of households in Baton Rouge earn Less than $10,000.
6.7% of households in Baton Rouge earn $10,000 to $14,999.
10.9% of households in Baton Rouge earn $15,000 to $24,999.
11.0% of households in Baton Rouge earn $25,000 to $34,999.
11.8% of households in Baton Rouge earn $35,000 to $49,999.
15.3% of households in Baton Rouge earn $50,000 to $74,999.
9.4% of households in Baton Rouge earn $75,000 to $99,999.
12.1% of households in Baton Rouge earn $100,000 to $149,999.
5.4% of households in Baton Rouge earn $150,000 to $199,999.
7.9% of households in Baton Rouge earn $200,000 or more.
| Income | Baton Rouge | LA | USA |
|---|---|---|---|
| Less than $10,000 | 9.5% | 7.4% | 4.9% |
| $10,000 to $14,999 | 6.7% | 6.0% | 3.8% |
| $15,000 to $24,999 | 10.9% | 10.0% | 7.0% |
| $25,000 to $34,999 | 11.0% | 9.2% | 7.4% |
| $35,000 to $49,999 | 11.8% | 11.8% | 10.7% |
| $50,000 to $74,999 | 15.3% | 15.9% | 16.1% |
| $75,000 to $99,999 | 9.4% | 11.5% | 12.8% |
| $100,000 to $149,999 | 12.1% | 14.6% | 17.1% |
| $150,000 to $199,999 | 5.4% | 6.8% | 8.8% |
| $200,000 or more | 7.9% | 6.8% | 11.4% |


