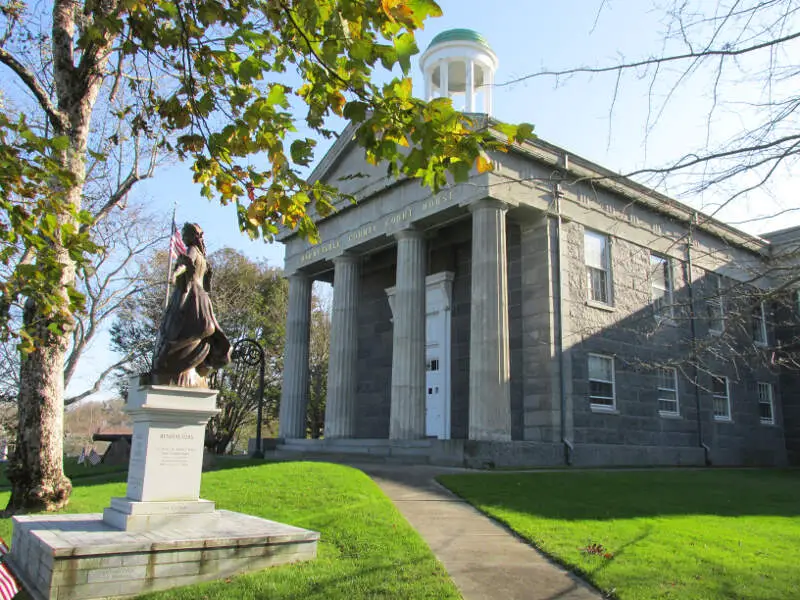

Life in Barnstable County research summary. HomeSnacks has been researching the quality of life in Barnstable County over the past eight years using Census data, FBI crime data, cost of living data, and other primary sources. Based on the most recently available data, we found the following about life in Barnstable County:
The population in Barnstable County is 229,436.
The median home value in Barnstable County is $699,972.
The median income in Barnstable County is $90,447.
The median rent in Barnstable County is $1,536.
The unemployment rate in Barnstable County is 4.5%.
The poverty rate in Barnstable County is 7.0%.
The average high in Barnstable County is 53.7° and there are 111.4 inches of rainfall annually.
The average high in Barnstable County is 53.7°.
There are 84.58 nice days each year.
Expect an average of 111.4 inches of rain each year with 10.3 inches of snow.
There is an average of 4:58 hours of sun each day in Barnstable County.
| Stat | Barnstable County |
|---|---|
| Mean High | 53.7 |
| Nice Days | 84.58 |
| Rainfall | 111.4 |
| Snowfall | 10.3 |
| Sunny_hours | 4:58 |


The current population in Barnstable County is 229,436. The population has increased 6.8% from 2019.
| Year | Population | % Change |
|---|---|---|
| 2022 | 227,942 | 6.8% |
| 2021 | 213,505 | 0.0% |
| 2020 | 213,496 | - |
Barnstable County is 51.7% female with 118,729 female residents.
Barnstable County is 48.3% male with 110,706 male residents.
| Gender | Barnstable County | MA | USA |
|---|---|---|---|
| Female | 51.7% | 51.0% | 50.4% |
| Male | 48.3% | 49.0% | 49.6% |
Barnstable County is:
86.5% White with 198,399 White residents.
2.8% African American with 6,384 African American residents.
0.4% American Indian with 912 American Indian residents.
1.5% Asian with 3,406 Asian residents.
0.0% Hawaiian with 20 Hawaiian residents.
1.3% Other with 3,023 Other residents.
4.0% Two Or More with 9,245 Two Or More residents.
3.5% Hispanic with 8,047 Hispanic residents.
| Race | Barnstable County | MA | USA |
|---|---|---|---|
| White | 86.5% | 68.9% | 58.9% |
| African American | 2.8% | 6.6% | 12.1% |
| American Indian | 0.4% | 0.1% | 0.6% |
| Asian | 1.5% | 6.9% | 5.7% |
| Hawaiian | 0.0% | 0.0% | 0.2% |
| Other | 1.3% | 1.0% | 0.4% |
| Two Or More | 4.0% | 3.9% | 3.5% |
| Hispanic | 3.5% | 12.6% | 18.7% |
3.5% of households in Barnstable County earn Less than $10,000.
2.7% of households in Barnstable County earn $10,000 to $14,999.
5.4% of households in Barnstable County earn $15,000 to $24,999.
5.8% of households in Barnstable County earn $25,000 to $34,999.
9.2% of households in Barnstable County earn $35,000 to $49,999.
15.1% of households in Barnstable County earn $50,000 to $74,999.
13.0% of households in Barnstable County earn $75,000 to $99,999.
17.3% of households in Barnstable County earn $100,000 to $149,999.
12.7% of households in Barnstable County earn $150,000 to $199,999.
15.4% of households in Barnstable County earn $200,000 or more.
| Income | Barnstable County | MA | USA |
|---|---|---|---|
| Less than $10,000 | 3.5% | 4.4% | 4.9% |
| $10,000 to $14,999 | 2.7% | 3.7% | 3.8% |
| $15,000 to $24,999 | 5.4% | 5.9% | 7.0% |
| $25,000 to $34,999 | 5.8% | 5.6% | 7.4% |
| $35,000 to $49,999 | 9.2% | 7.8% | 10.7% |
| $50,000 to $74,999 | 15.1% | 12.7% | 16.1% |
| $75,000 to $99,999 | 13.0% | 11.3% | 12.8% |
| $100,000 to $149,999 | 17.3% | 17.7% | 17.1% |
| $150,000 to $199,999 | 12.7% | 11.6% | 8.8% |
| $200,000 or more | 15.4% | 19.3% | 11.4% |
2.0% of adults in Barnstable County completed < 9th grade.
3.0% of adults in Barnstable County completed 9-12th grade.
21.0% of adults in Barnstable County completed high school / ged.
18.0% of adults in Barnstable County completed some college.
10.0% of adults in Barnstable County completed associate's degree.
25.0% of adults in Barnstable County completed bachelor's degree.
15.0% of adults in Barnstable County completed master's degree.
3.0% of adults in Barnstable County completed professional degree.
3.0% of adults in Barnstable County completed doctorate degree.
| Education | Barnstable County | MA | USA |
|---|---|---|---|
| < 9th Grade | 2% | 3% | 3% |
| 9-12th Grade | 3% | 5% | 6% |
| High School / GED | 21% | 23% | 26% |
| Some College | 18% | 15% | 20% |
| Associate's Degree | 10% | 8% | 9% |
| Bachelor's Degree | 25% | 25% | 21% |
| Master's Degree | 15% | 15% | 10% |
| Professional Degree | 3% | 3% | 2% |
| Doctorate Degree | 3% | 3% | 2% |
HomeSnacks is based in Durham, NC.
We aim to deliver bite-sized pieces of infotainment about where you live.
We use data, analytics, and a sense of humor to determine quality of life for places across the nation.