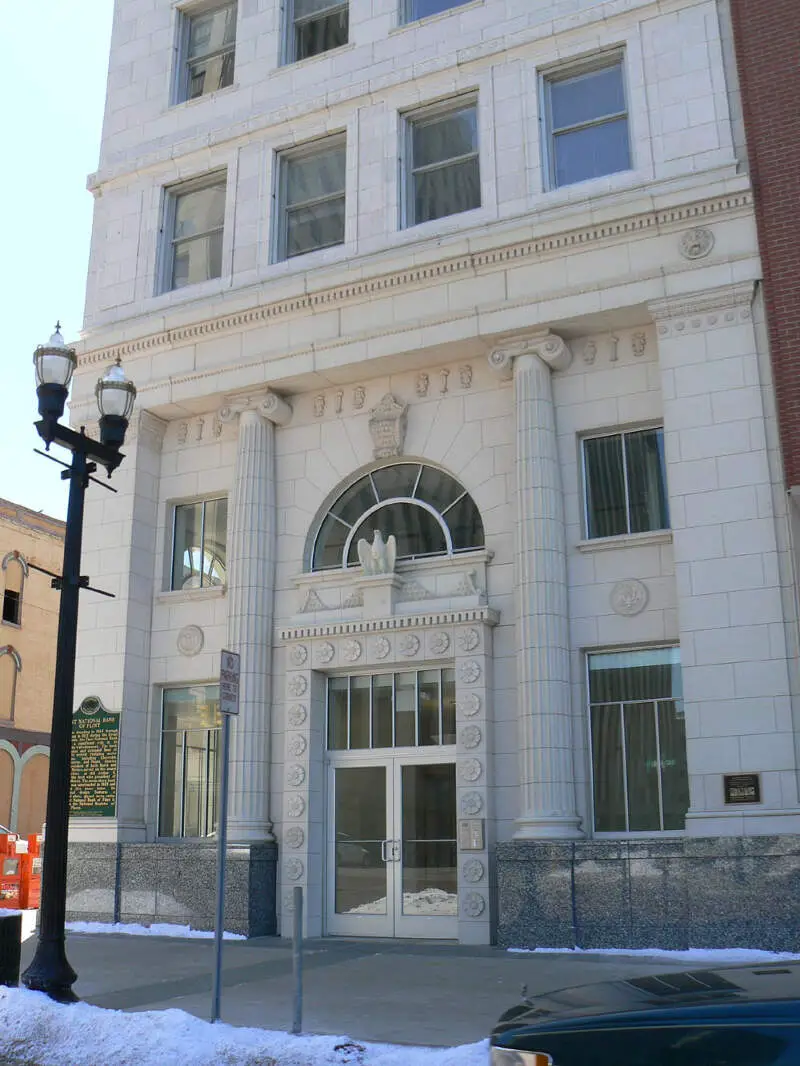
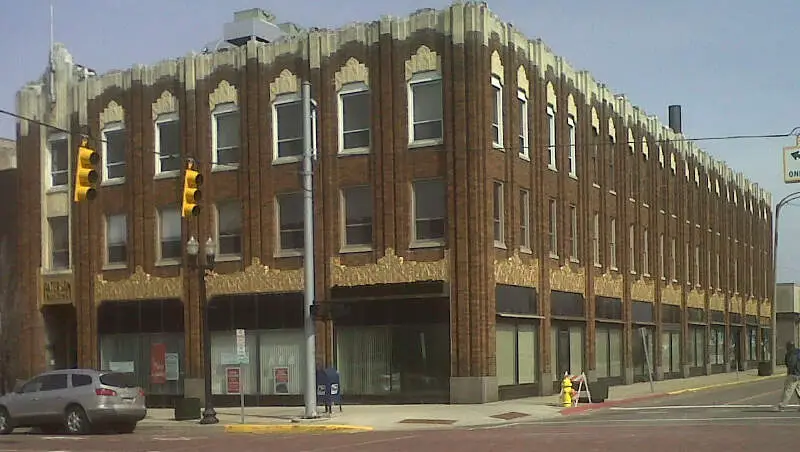
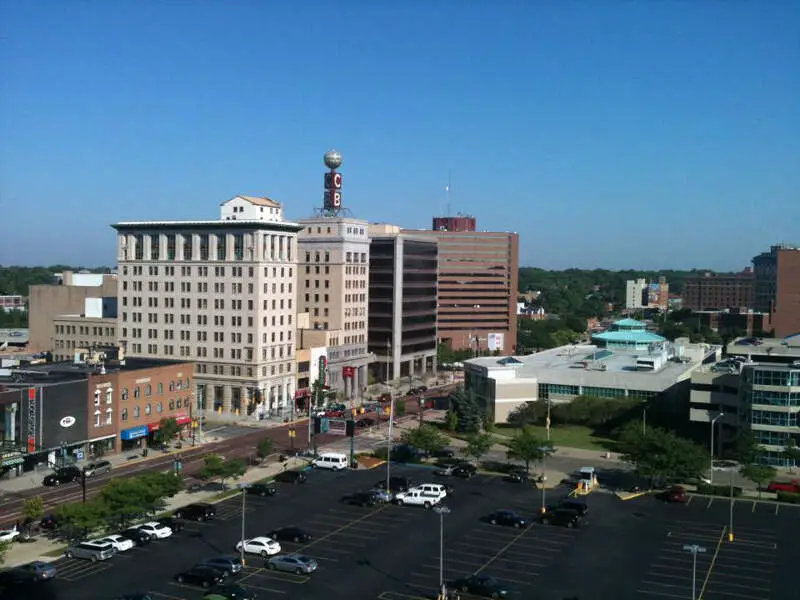
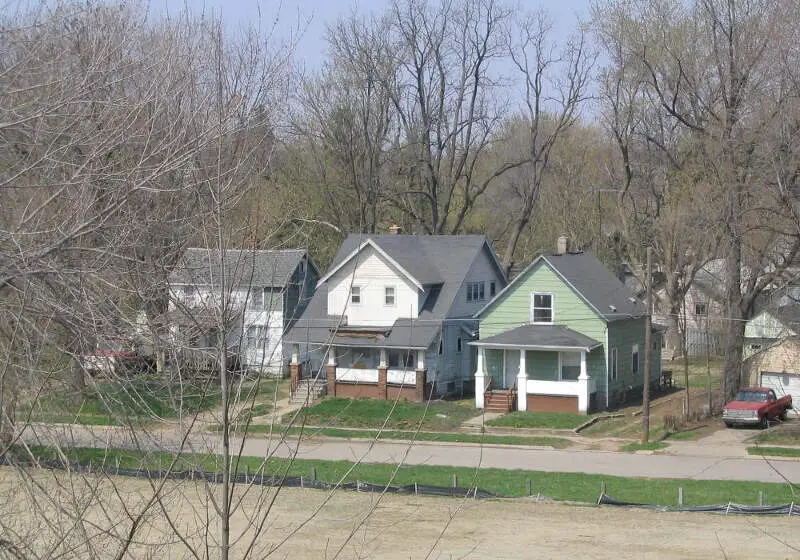
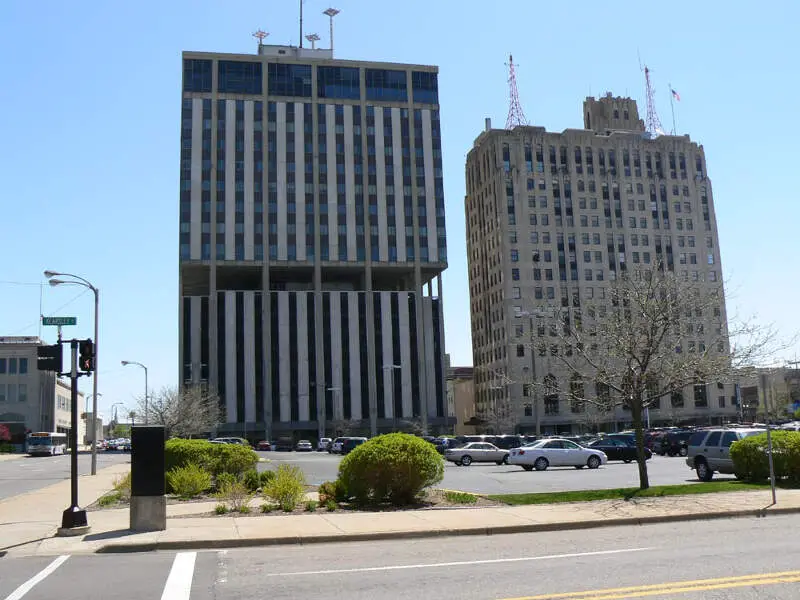
Flint, MI
Demographics And Statistics
Living In Flint, Michigan Summary
Life in Flint research summary. HomeSnacks has been using Saturday Night Science to research the quality of life in Flint over the past nine years using Census, FBI, Zillow, and other primary data sources. Based on the most recently available data, we found the following about life in Flint:
The population in Flint is 81,863.
The median home value in Flint is $48,574.
The median income in Flint is $35,451.
The cost of living in Flint is 83 which is 0.8x lower than the national average.
The median rent in Flint is $825.
The unemployment rate in Flint is 17.6%.
The poverty rate in Flint is 33.3%.
The average high in Flint is 57.3° and the average low is 37.7°.
Flint SnackAbility
Overall SnackAbility
Flint, MI Crime Report
Crime in Flint summary. We use data from the FBI to determine the crime rates in Flint. Key points include:
There were 2,032 total crimes in Flint in the last reporting year.
The overall crime rate per 100,000 people in Flint is 2,538.1 / 100k people.
The violent crime rate per 100,000 people in Flint is 1,230.3 / 100k people.
The property crime rate per 100,000 people in Flint is 1,307.8 / 100k people.
Overall, crime in Flint is 9.20% above the national average.
Total Crimes
Above National Average
Crime In Flint Comparison Table
| Statistic | Count Raw |
Flint / 100k People |
Michigan / 100k People |
National / 100k People |
|---|---|---|---|---|
| Total Crimes Per 100K | 2,032 | 2,538.1 | 1,838.9 | 2,324.2 |
| Violent Crime | 985 | 1,230.3 | 478.0 | 369.8 |
| Murder | 13 | 16.2 | 7.6 | 6.3 |
| Robbery | 28 | 35.0 | 44.5 | 66.1 |
| Aggravated Assault | 860 | 1,074.2 | 365.1 | 268.2 |
| Property Crime | 1,047 | 1,307.8 | 1,360.9 | 1,954.4 |
| Burglary | 189 | 236.1 | 233.1 | 269.8 |
| Larceny | 689 | 860.6 | 943.3 | 1,401.9 |
| Car Theft | 169 | 211.1 | 184.5 | 282.7 |
Flint, MI Cost Of Living
Cost of living in Flint summary. We use data on the cost of living to determine how expensive it is to live in Flint. Real estate prices drive most of the variance in cost of living around Michigan. Key points include:
The cost of living in Flint is 83 with 100 being average.
The cost of living in Flint is 0.8x lower than the national average.
The median home value in Flint is $48,574.
The median income in Flint is $35,451.
Flint's Overall Cost Of Living
Lower Than The National Average
Cost Of Living In Flint Comparison Table
| Living Expense | Flint | Michigan | National Average | |
|---|---|---|---|---|
| Overall | 83 | 92 | 100 | |
| Services | 106 | 96 | 100 | |
| Groceries | 103 | 96 | 100 | |
| Health | 97 | 94 | 100 | |
| Housing | 31 | 80 | 100 | |
| Transportation | 100 | 97 | 100 | |
| Utilities | 98 | 100 | 100 | |
Flint, MI Weather
The average high in Flint is 57.3° and the average low is 37.7°.
There are 68.5 days of precipitation each year.
Expect an average of 31.7 inches of precipitation each year with 38.2 inches of snow.
| Stat | Flint |
|---|---|
| Average Annual High | 57.3 |
| Average Annual Low | 37.7 |
| Annual Precipitation Days | 68.5 |
| Average Annual Precipitation | 31.7 |
| Average Annual Snowfall | 38.2 |
Average High
Days of Rain
Flint, MI Photos
4 Reviews & Comments About Flint
/5

Legocat's Builds -
I hate how the media paints these cities as if they are the worst places to live and there is nothing good about them. These places actually have a lot of things to do and see. I live in Davison, a suburb of Flint. Yea, it is kinda crappy and unsafe but there are historical things to see and good restaurants. I love it and I hate how everybody who doesn't live in Michigan stereotypes these places. Don't make assumptions unless u have actually been here. I also hate how people think Michigan s***s because of just a few cities in central Michigan. Michigan is actually a very beautiful place and it is the best state I've ever been in or seen.
Sawyer92 -
Actually, You Can Tell Someone's From Flint If They Are Drinking Milk. I Live In Utah, But I Went Down To Detroit To Try To Fight TacTix, I Failed Because I Drove To Far North And Almost Ended Up In Canada.
Jeff Dunn -
I live in Flint. I hate it! Your assessment is right on.
HomeSnacks User - 2018-07-14 16:18:13.172044
There is do much crime daily in Flint. People are killed and dumped in the river or left in boarded up abandoned houses that are on every street in every neighborhood. Drugs and prostitution is rampant. Kids so not play outside, are scared to go to school or walk to stores. A h**l on earth.
Businesses have died off over several years. Owners are shot or beat up by robbers. Some stores are set on fire. Many malls are barely full of shops. Everywhere is not safe.
Rankings for Flint in Michigan


Locations Around Flint
Map Of Flint, MI
Best Places Around Flint
Grand Blanc, MI
Population 8,034
Holly, MI
Population 5,997
Lake Fenton, MI
Population 6,316
Flushing, MI
Population 8,349
Burton, MI
Population 29,568
Fenton, MI
Population 11,967
Swartz Creek, MI
Population 5,865
Davison, MI
Population 5,114
Lapeer, MI
Population 9,034
Beecher, MI
Population 9,085
Flint Demographics And Statistics
Population over time in Flint
The current population in Flint is 81,863. The population has decreased -24.1% from 2010.
| Year | Population | % Change |
|---|---|---|
| 2022 | 81,863 | -15.7% |
| 2021 | 97,161 | -0.7% |
| 2020 | 97,810 | -1.1% |
| 2019 | 98,918 | -0.9% |
| 2018 | 99,802 | -0.8% |
| 2017 | 100,569 | -1.1% |
| 2016 | 101,649 | -1.6% |
| 2015 | 103,263 | -2.0% |
| 2014 | 105,391 | -2.2% |
| 2013 | 107,807 | - |
Race / Ethnicity in Flint
Flint is:
33.7% White with 27,569 White residents.
55.6% African American with 45,544 African American residents.
0.3% American Indian with 284 American Indian residents.
0.5% Asian with 416 Asian residents.
0.0% Hawaiian with 32 Hawaiian residents.
0.2% Other with 193 Other residents.
5.3% Two Or More with 4,344 Two Or More residents.
4.3% Hispanic with 3,481 Hispanic residents.
| Race | Flint | MI | USA |
|---|---|---|---|
| White | 33.7% | 73.5% | 58.9% |
| African American | 55.6% | 13.4% | 12.1% |
| American Indian | 0.3% | 0.3% | 0.6% |
| Asian | 0.5% | 3.2% | 5.7% |
| Hawaiian | 0.0% | 0.0% | 0.2% |
| Other | 0.2% | 0.3% | 0.4% |
| Two Or More | 5.3% | 3.7% | 3.5% |
| Hispanic | 4.3% | 5.5% | 18.7% |
Gender in Flint
Flint is 50.5% female with 41,371 female residents.
Flint is 49.5% male with 40,492 male residents.
| Gender | Flint | MI | USA |
|---|---|---|---|
| Female | 50.5% | 50.4% | 50.4% |
| Male | 49.5% | 49.6% | 49.6% |
Highest level of educational attainment in Flint for adults over 25
3.0% of adults in Flint completed < 9th grade.
12.0% of adults in Flint completed 9-12th grade.
37.0% of adults in Flint completed high school / ged.
27.0% of adults in Flint completed some college.
8.0% of adults in Flint completed associate's degree.
8.0% of adults in Flint completed bachelor's degree.
4.0% of adults in Flint completed master's degree.
1.0% of adults in Flint completed professional degree.
0.0% of adults in Flint completed doctorate degree.
| Education | Flint | MI | USA |
|---|---|---|---|
| < 9th Grade | 3.0% | 2.0% | 4.0% |
| 9-12th Grade | 12.0% | 6.0% | 6.0% |
| High School / GED | 37.0% | 28.0% | 26.0% |
| Some College | 27.0% | 23.0% | 20.0% |
| Associate's Degree | 8.0% | 10.0% | 9.0% |
| Bachelor's Degree | 8.0% | 19.0% | 21.0% |
| Master's Degree | 4.0% | 9.0% | 10.0% |
| Professional Degree | 1.0% | 2.0% | 2.0% |
| Doctorate Degree | 0.0% | 1.0% | 2.0% |
Household Income For Flint, Michigan
14.8% of households in Flint earn Less than $10,000.
10.3% of households in Flint earn $10,000 to $14,999.
12.4% of households in Flint earn $15,000 to $24,999.
11.8% of households in Flint earn $25,000 to $34,999.
16.9% of households in Flint earn $35,000 to $49,999.
16.5% of households in Flint earn $50,000 to $74,999.
8.0% of households in Flint earn $75,000 to $99,999.
6.0% of households in Flint earn $100,000 to $149,999.
1.8% of households in Flint earn $150,000 to $199,999.
1.5% of households in Flint earn $200,000 or more.
| Income | Flint | MI | USA |
|---|---|---|---|
| Less than $10,000 | 14.8% | 5.0% | 4.9% |
| $10,000 to $14,999 | 10.3% | 4.1% | 3.8% |
| $15,000 to $24,999 | 12.4% | 7.5% | 7.0% |
| $25,000 to $34,999 | 11.8% | 8.2% | 7.4% |
| $35,000 to $49,999 | 16.9% | 12.1% | 10.7% |
| $50,000 to $74,999 | 16.5% | 17.2% | 16.1% |
| $75,000 to $99,999 | 8.0% | 13.4% | 12.8% |
| $100,000 to $149,999 | 6.0% | 16.5% | 17.1% |
| $150,000 to $199,999 | 1.8% | 7.8% | 8.8% |
| $200,000 or more | 1.5% | 8.2% | 11.4% |


