Racial diversity in Delaware is a mixed bag.
There are parts of Delaware where there’s a high level of diversity. But where will you find the most diverse places in Delaware?
To answer that question, we went to the US Census data. Using Saturday Night Science, we measured the Gini coefficient for all 21 cities in Delaware to rank them from most to least diverse.
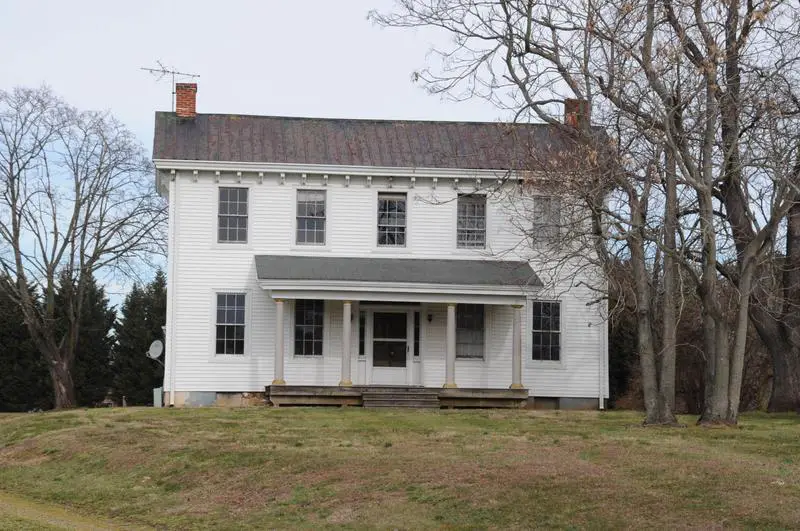
#1 most diverse in Delaware
 Located in
New Castle County, Delaware
Located in
New Castle County, Delaware
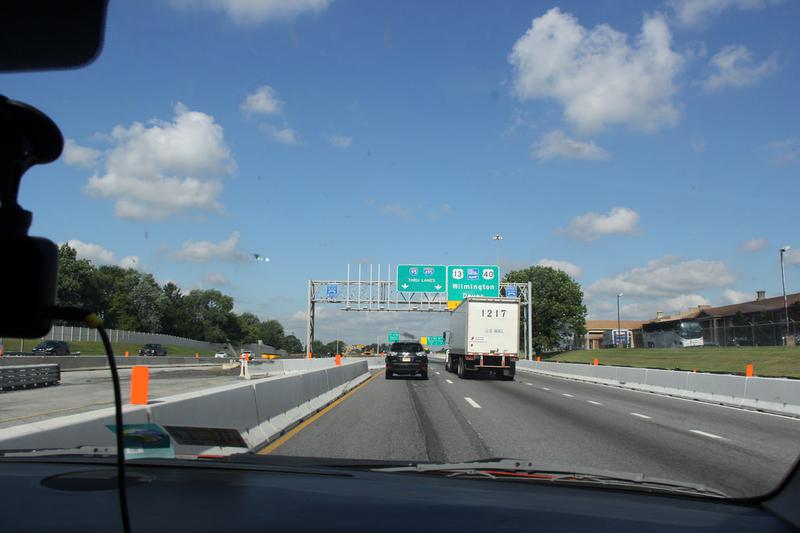
Bear is a census-designated place in New Castle County, Delaware, United States. The population was 17,593 at the 2000 census.
Data | Crime | Cost of living | Movers
#2 most diverse in Delaware
 Located in
New Castle County, Delaware
Located in
New Castle County, Delaware
Data | Crime | Cost of living | Movers
#3 most diverse in Delaware
 Located in
Sussex County, Delaware
Located in
Sussex County, Delaware
Seaford is a city located along the Nanticoke River in Sussex County, Delaware. According to the 2010 Census Bureau figures, the population of the city is 6,928, an increase of 3.4% from the 2000 census. It is part of the Salisbury, Maryland-Delaware Metropolitan Statistical Area.
Data | Crime | Cost of living | Movers
#4 most diverse in Delaware
 Located in
Kent County, Delaware
Located in
Kent County, Delaware
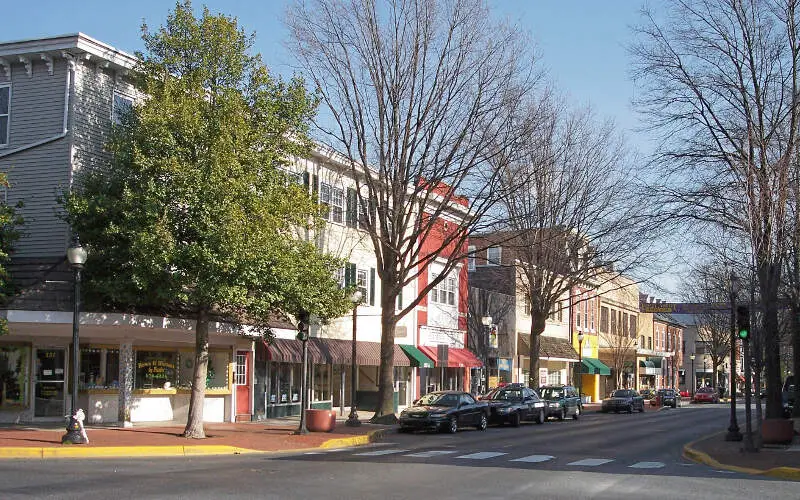
Dover is the capital and second-largest city in the U.S. state of Delaware. It is also the county seat of Kent County, and the principal city of the Dover, DE Metropolitan Statistical Area, which encompasses all of Kent County and is part of the Philadelphia-Wilmington-Camden, PA-NJ-DE-MD Combined Statistical Area. It is located on the St. Jones River in the Delaware River coastal plain. It was named by William Penn of Dover in Kent, England. As of 2010, the city had a population of 36,047.
Data | Crime | Cost of living | Movers
#5 most diverse in Delaware
 Located in
New Castle County, Delaware
Located in
New Castle County, Delaware
Data | Crime | Cost of living | Movers
#6 most diverse in Delaware
 Located in
New Castle County, Delaware
Located in
New Castle County, Delaware
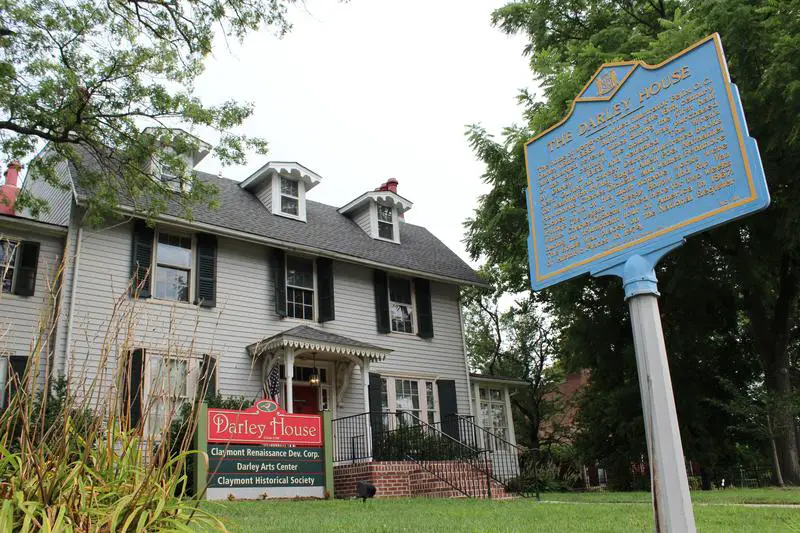
Claymont is a census-designated place in New Castle County, Delaware, United States. The population was 8,253 at the 2010 census.
Data | Crime | Cost of living | Movers
#7 most diverse in Delaware
 Located in
New Castle County, Delaware
Located in
New Castle County, Delaware
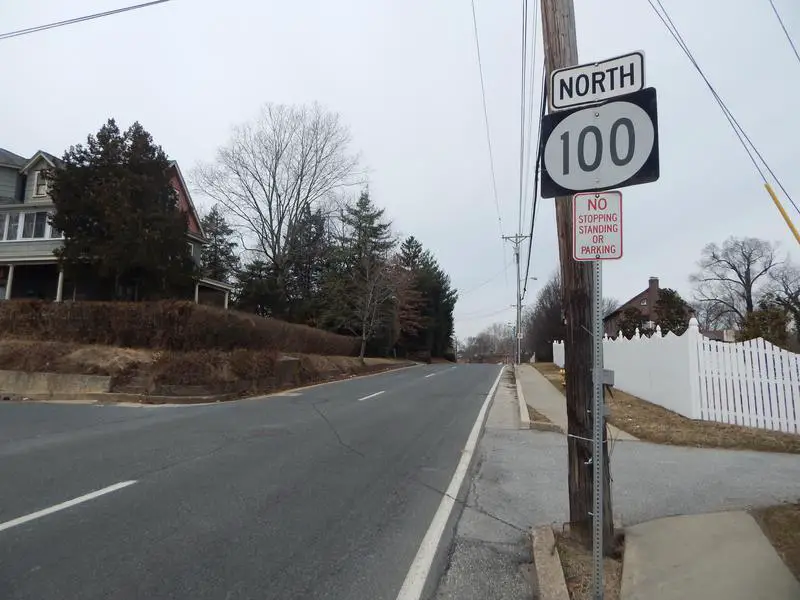
Elsmere is a town in New Castle County, Delaware, United States, bordering the city of Wilmington along Wilmington’s western border. According to the 2010 Census, the population of the town is 6,131.
Data | Crime | Cost of living | Movers
#8 most diverse in Delaware
 Located in
Sussex County, Delaware
Located in
Sussex County, Delaware
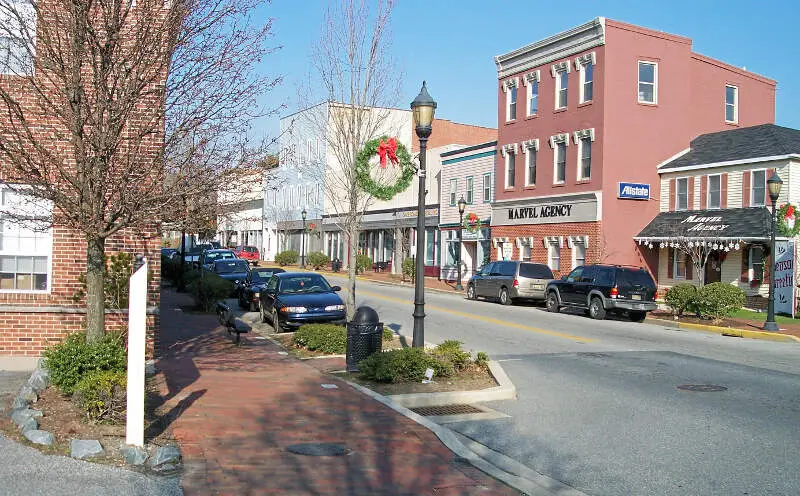
Milford is a city in Kent and Sussex counties in the U.S. state of Delaware. According to the 2010 census, the population of the city is 9,559.
Data | Crime | Cost of living | Movers
#9 most diverse in Delaware
 Located in
New Castle County, Delaware
Located in
New Castle County, Delaware
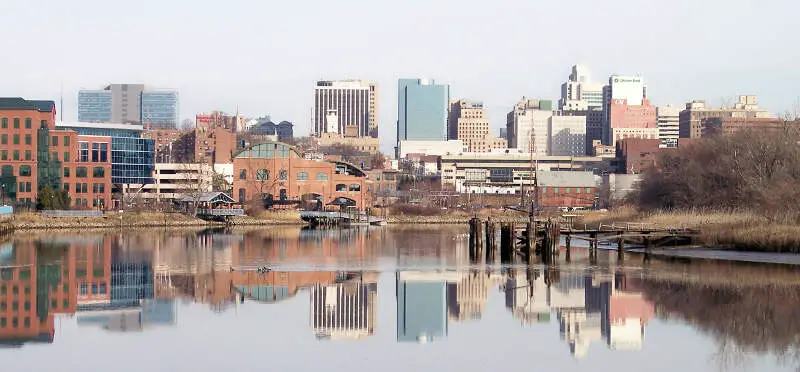
Wilmington is the most populous city in the U.S. state of Delaware. The city was built on the site of Fort Christina, the first Swedish settlement in North America. It is at the confluence of the Christina River and Brandywine River, near where the Christina flows into the Delaware River. It is the county seat of New Castle County and one of the major cities in the Delaware Valley metropolitan area. Wilmington was named by Proprietor Thomas Penn after his friend Spencer Compton, Earl of Wilmington, who was prime minister in the reign of George II of Great Britain.
Data | Crime | Cost of living | Movers
#10 most diverse in Delaware
Data | Crime | Cost of living | Movers
The receipts
Compare the top ten
Pick a metric. The bars rescale. The red line is Delaware’s statewide median.
On the map
Where diversity lives in Delaware
Saturday Night Science
Methodology: How we determined the most diverse cities in Delaware for 2026
We still believe in the accuracy of data — especially from the Census — and Saturday Night Science. So that’s where we went to get the race breakdown across Delaware.
That leads us to the Census’s most recently available data, the 2020-2024 American Community Survey data from the US Census.
Specifically, we looked at table B03002: HISPANIC OR LATINO ORIGIN BY RACE. Here are the category names as defined by the Census:
- White alone*
- Black or African American alone*
- American Indian and Alaska Native alone*
- Asian alone*
- Native Hawaiian and Other Pacific Islander alone*
- Some other race alone*
- Two or more races*
- Hispanic or Latino
We limited our analysis to non-CDPs with a population greater than 5,000 people. That left us with 21 cities.
We then calculated the HHI for each city by finding the racial breakdown of a city in percent terms, squaring them, and then adding the squares together. This left us with scores ranging from 2,802 (Bear) to 6,172 (North Star).
Finally, we ranked each city based on the HHI, with a lower score being more diverse than a high score. Bear took the distinction of being the most diverse, while North Star was the least diverse city.
We updated this article for 2026. This report is our eleventh time ranking the most diverse places in Delaware.
The full plate
Race By City In Delaware For 2026
Click any column to sort. Search by city name.
| Rank | City | Population | HHI | % White | % Black | % Hispanic | % Asian |
|---|---|---|---|---|---|---|---|
| 1 | Bear | 22,370 | 2,802 | 29.2% | 37.7% | 21.2% | 8.3% |
| 2 | Wilmington Manor | 8,214 | 2,946 | 43.1% | 22.5% | 23.2% | 4.5% |
| 3 | Seaford | 8,485 | 3,268 | 49.0% | 22.4% | 12.5% | 1.2% |
| 4 | Dover | 39,837 | 3,331 | 34.1% | 44.8% | 10.7% | 2.9% |
| 5 | Brookside | 15,115 | 3,345 | 49.8% | 17.6% | 22.0% | 7.7% |
| 6 | Claymont | 8,786 | 3,367 | 49.0% | 27.7% | 9.1% | 10.1% |
| 7 | Elsmere | 6,203 | 3,509 | 41.5% | 18.2% | 38.1% | 0.0% |
| 8 | Milford | 12,803 | 3,587 | 53.7% | 19.5% | 16.5% | 4.6% |
| 9 | Wilmington | 71,727 | 3,694 | 29.3% | 51.6% | 11.9% | 1.6% |
| 10 | Georg | 7,660 | 3,706 | 33.2% | 11.0% | 49.6% | 0.3% |
| 11 | Middl | 24,661 | 3,728 | 51.8% | 31.0% | 5.9% | 4.2% |
| 12 | Smyrna | 13,165 | 3,855 | 53.9% | 28.0% | 11.8% | 1.3% |
| 13 | Glasgow | 15,546 | 3,912 | 56.0% | 25.5% | 5.8% | 8.3% |
| 14 | Pike Creek | 7,129 | 3,962 | 57.0% | 2.9% | 10.5% | 23.7% |
| 15 | Millsboro | 7,424 | 4,321 | 62.3% | 16.8% | 10.4% | 3.6% |
| 16 | Edgemoor | 6,349 | 4,437 | 51.9% | 41.5% | 3.2% | 2.4% |
| 17 | New Castle | 5,579 | 4,525 | 60.4% | 28.4% | 8.1% | 0.9% |
| 18 | Newark | 30,330 | 4,597 | 65.5% | 9.9% | 10.3% | 8.9% |
| 19 | Pike Creek Valley | 12,431 | 4,780 | 67.0% | 11.7% | 8.2% | 6.3% |
| 20 | Hockessin | 13,439 | 6,108 | 76.8% | 1.2% | 3.7% | 12.9% |
| 21 | North Star | 7,834 | 6,172 | 77.4% | 4.2% | 2.0% | 12.2% |
Source: U.S. Census ACS 2020-2024. 21 cities with more than 5,000 residents.
Summary
Summary: Diversity Across Delaware
If you’re looking for a scientific breakdown of diversity across Delaware, this is an accurate list.
The most diverse cities in Delaware are Bear, Wilmington Manor, Seaford, Dover, Brookside, Claymont, Elsmere, Milford, Wilmington, and Georg.