Racial diversity in Texas is a mixed bag.
There are parts of Texas where there’s a high level of diversity. But where will you find the most diverse places in Texas?
To answer that question, we went to the US Census data. Using Saturday Night Science, we measured the Gini coefficient for all 372 cities in Texas to rank them from most to least diverse.
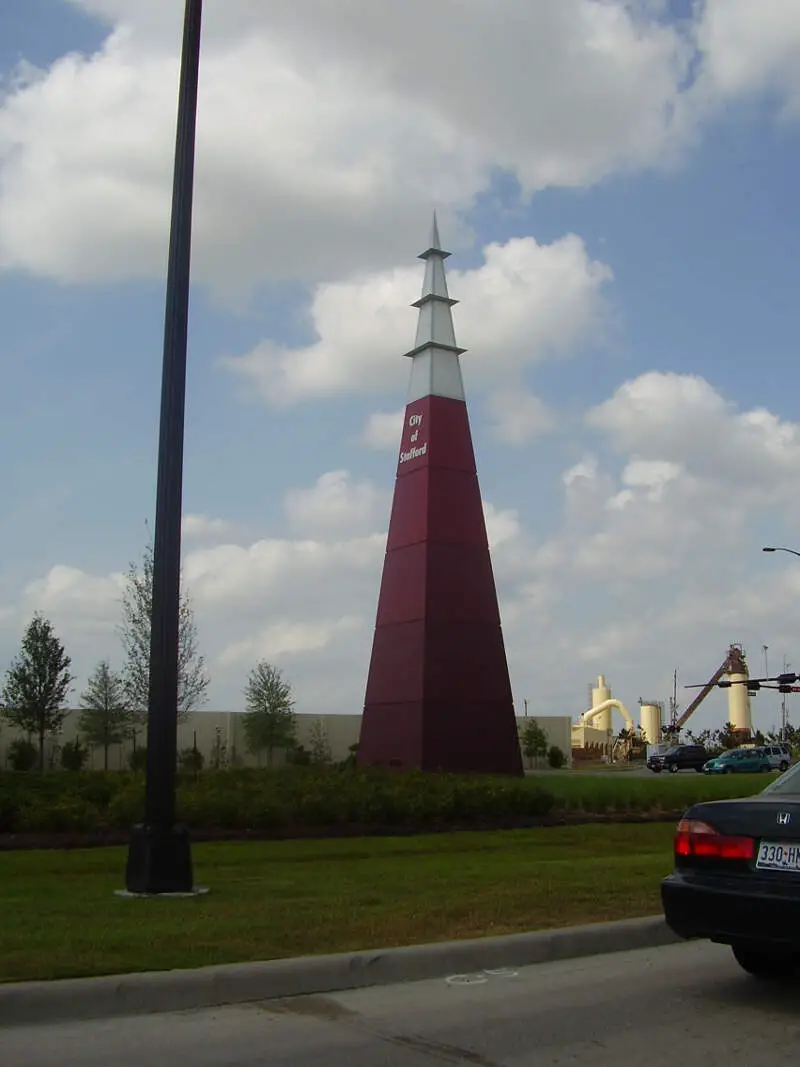
#1 most diverse in Texas
Stafford is a city in the U.S. state of Texas, within the Houston-The Woodlands-Sugar Land metropolitan area. The city is mostly in FortBendCounty, with a small portion in HarrisCounty. As of the 2010 census, Stafford’s population was 17,693, up from 15,681 at the 2000 census. As of 2015 the population had risen to an estimated 18,459.
Data | Crime | Cost of living | Movers
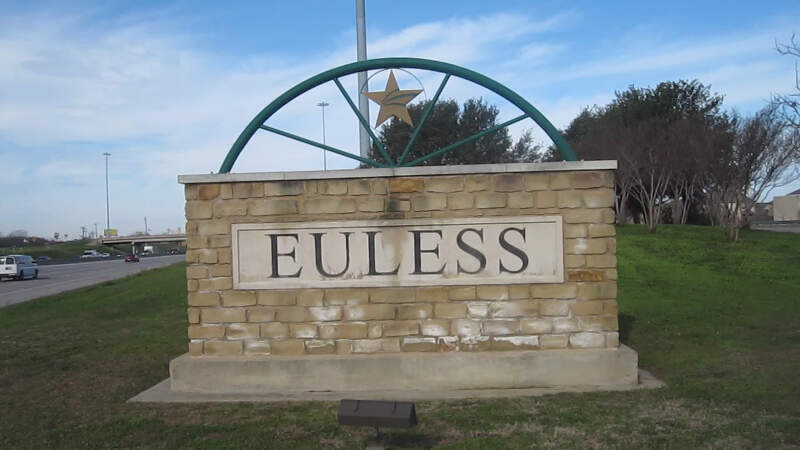
#2 most diverse in Texas
Euless is a city in Tarrant County, Texas, United States, and a suburb of Dallas and Fort Worth. Euless is part of the Mid-Cities between Dallas and Fort Worth. The population was 51,277 at the 2010 census.
Data | Crime | Cost of living | Movers
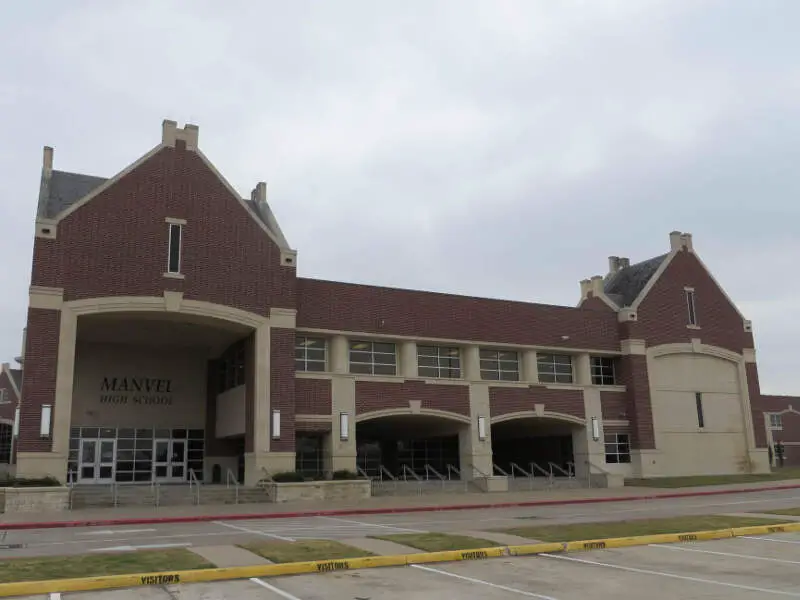
#3 most diverse in Texas
Data | Crime | Cost of living | Movers
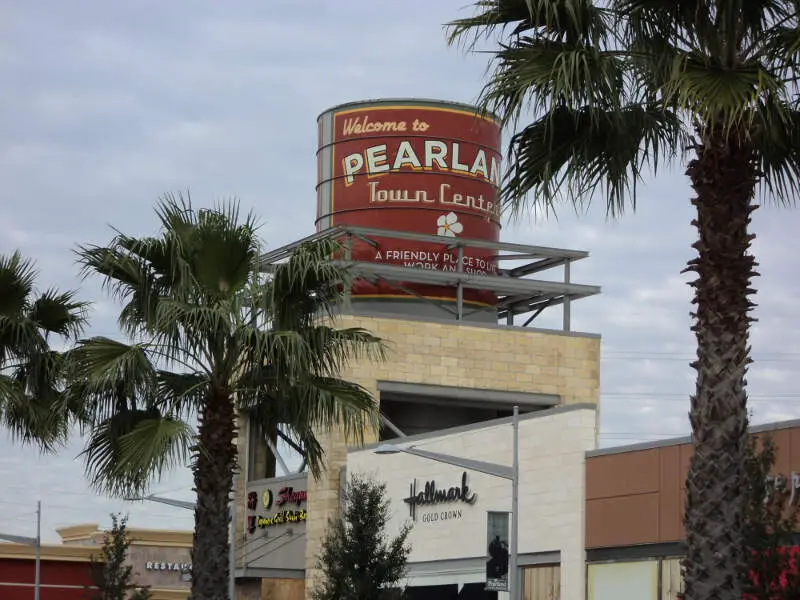
#4 most diverse in Texas
Pearland is a city in the U.S. state of Texas, within the Houston-The Woodlands-Sugar Land metropolitan area. Most of the city is in Brazoria County, with portions extending into FortBend and Harris counties. As of the 2010 census, the city’s population was 91,252, up from a population of 37,640 at the 2000 census. Pearland’s population growth rate from 2000 to 2010 was 142 percent, which ranked Pearland as the 15th fastest growing city in the U.S. during that time period, compared to other cities with a population of 10,000 or greater in 2000. Pearland is the third largest city in the Houston MSA, and from 2000 to 2010, ranked as the fastest growing city in the Houston MSA and the second fastest growing city in Texas. As of 2015 the population had risen to an estimated 108,821.
Data | Crime | Cost of living | Movers
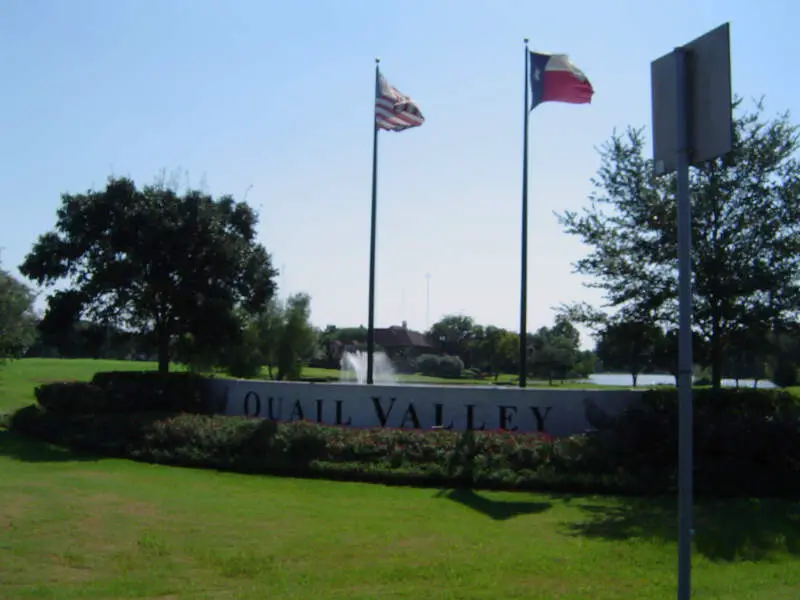
#5 most diverse in Texas
Missouri City is a city in the U.S. state of Texas, within the Houston-The Woodlands-Sugar Land metropolitan area. The city is mostly in FortBend County, with a small portion in HarrisCounty. As of the 2010 census, the city had a population of 67,358, up from 52,913 in 2000. The population was estimated at 74,139 in 2015.
Data | Crime | Cost of living | Movers
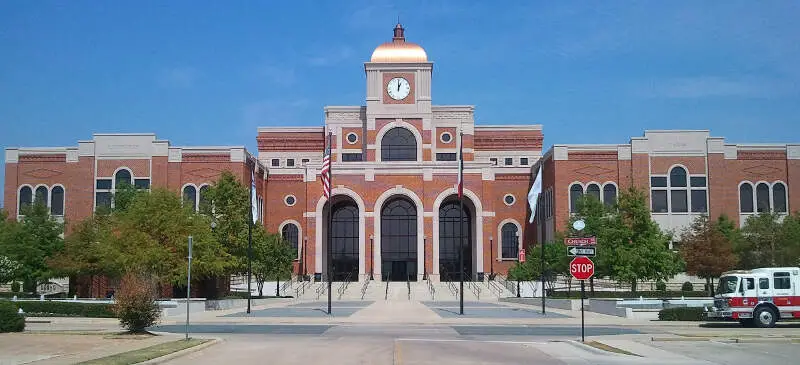
#6 most diverse in Texas
Lewisville is a city in Denton County, Texas, United States. It is a northwestern suburb of Dallas. The 2000 United States Census placed the city’s population at 77,737 and the 2010 Census placed it at 95,290, making it one of the fastest-growing city populations in the United States and the 33rd most populous in Texas. It occupies 36.4 square miles of land and includes 6.07 square miles of Lewisville Lake.
Data | Crime | Cost of living | Movers
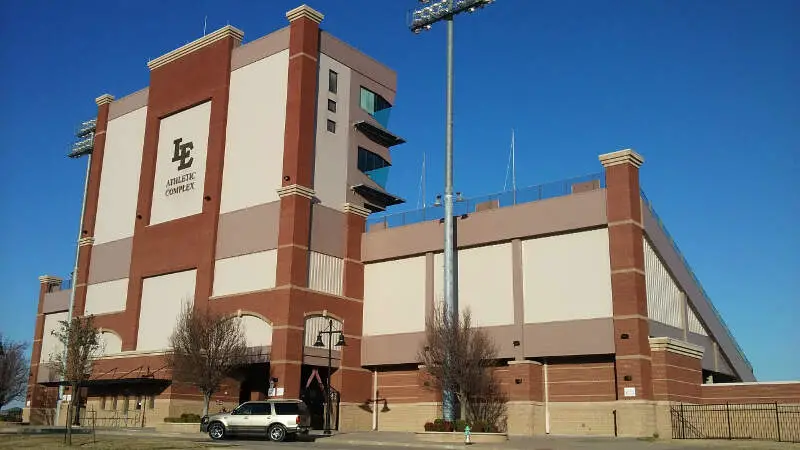
#7 most diverse in Texas
Data | Crime | Cost of living | Movers
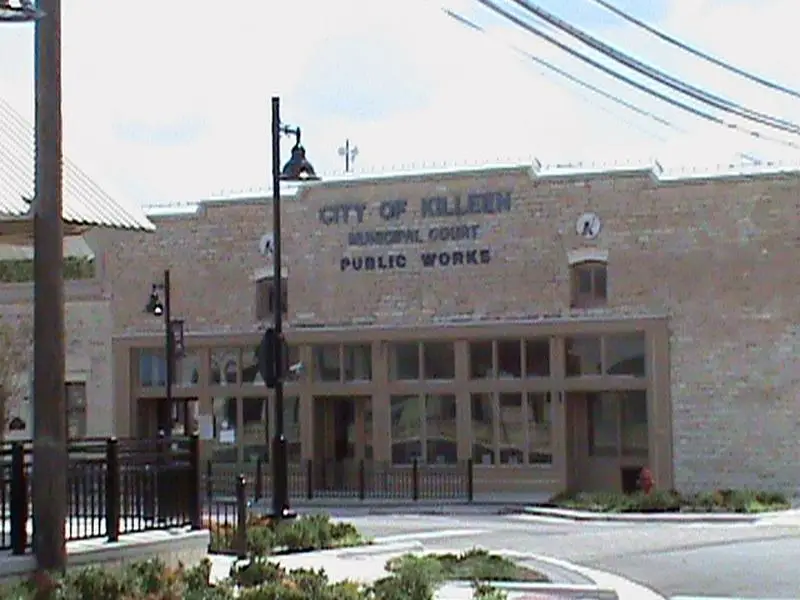
#8 most diverse in Texas
Killeen is a city in Bell County, Texas, United States. According to the 2010 census, its population was 127,921, making it the 2most populous city in Texas. It is the principal city of the Killeen-Temple-Fort Hood Metropolitan Statistical Area.
Data | Crime | Cost of living | Movers
#9 most diverse in Texas
Pflugerville is a city in Travis County, Texas with a small portion in Williamson County. The population was 46,936 at the 2010 census. Pflugerville is a suburb of Austin and part of the Austin-Round Rock-San Marcos Metropolitan Statistical Area.
Data | Crime | Cost of living | Movers
#10 most diverse in Texas
Harker Heights is a city in Bell County, Texas, United States. As of the 2010 census there were 26,700 people, 9,488 households, and 7,139 families residing in the city, up from a population of 17,308 in 2000. This makes Harker Heights the third largest city in Bell County, after Killeen and Temple. Incorporated in 1960, the city derives its name from one of the two original landowners and founder, Harley Kern. Harker Heights is part of the Killeen-Temple-Fort Hood Metropolitan Statistical Area. People usually refer to the town as just “Heights”.
Data | Crime | Cost of living | Movers
The receipts
Compare the top ten
Pick a metric. The bars rescale. The red line is Texas’s statewide median.
On the map
Where diversity lives in Texas
Saturday Night Science
Methodology: How we determined the most diverse cities in Texas for 2026
We still believe in the accuracy of data — especially from the Census — and Saturday Night Science. So that’s where we went to get the race breakdown across Texas.
That leads us to the Census’s most recently available data, the 2020-2024 American Community Survey data from the US Census.
Specifically, we looked at table B03002: HISPANIC OR LATINO ORIGIN BY RACE. Here are the category names as defined by the Census:
- White alone*
- Black or African American alone*
- American Indian and Alaska Native alone*
- Asian alone*
- Native Hawaiian and Other Pacific Islander alone*
- Some other race alone*
- Two or more races*
- Hispanic or Latino
We limited our analysis to non-CDPs with a population greater than 5,000 people. That left us with 372 cities.
We then calculated the HHI for each city by finding the racial breakdown of a city in percent terms, squaring them, and then adding the squares together. This left us with scores ranging from 2,391 (Stafford) to 9,747 (Hidalgo).
Finally, we ranked each city based on the HHI, with a lower score being more diverse than a high score. Stafford took the distinction of being the most diverse, while Hidalgo was the least diverse city.
We updated this article for 2026. This report is our eleventh time ranking the most diverse places in Texas.
The full plate
Race By City In Texas For 2026
Click any column to sort. Search by city name.
| Rank | City | Population | HHI | % White | % Black | % Hispanic | % Asian |
|---|---|---|---|---|---|---|---|
| 1 | Stafford | 17,401 | 2,391 | 13.9% | 29.0% | 27.2% | 24.2% |
| 2 | Euless | 60,421 | 2,425 | 37.3% | 17.2% | 22.3% | 13.3% |
| 3 | Manvel | 14,758 | 2,534 | 33.2% | 28.8% | 20.1% | 13.4% |
| 4 | Pearland | 127,514 | 2,583 | 36.4% | 19.2% | 25.4% | 15.5% |
| 5 | Missouri City | 76,558 | 2,589 | 18.1% | 38.3% | 20.8% | 18.8% |
| 6 | Lewisville | 131,080 | 2,667 | 38.2% | 14.2% | 27.5% | 15.1% |
| 7 | Little Elm | 54,820 | 2,704 | 41.3% | 21.3% | 19.8% | 10.9% |
| 8 | Killeen | 158,159 | 2,714 | 25.6% | 35.5% | 27.2% | 3.9% |
| 9 | Pflugerville | 65,971 | 2,725 | 34.5% | 17.5% | 33.5% | 9.3% |
| 10 | Harker Heights | 34,128 | 2,739 | 39.4% | 27.1% | 19.5% | 3.4% |
| 11 | Arlington | 397,742 | 2,752 | 34.1% | 22.1% | 32.2% | 7.3% |
| 12 | Converse | 29,607 | 2,845 | 26.5% | 24.9% | 38.4% | 3.4% |
| 13 | Carrollton | 133,740 | 2,846 | 37.4% | 8.9% | 32.3% | 17.7% |
| 14 | Katy | 25,184 | 2,896 | 41.5% | 11.2% | 29.8% | 11.6% |
| 15 | Irving | 256,492 | 2,901 | 17.8% | 12.7% | 43.4% | 23.1% |
| 16 | Sachse | 30,491 | 2,936 | 45.8% | 12.5% | 16.6% | 19.7% |
| 17 | Fort Worth | 963,194 | 2,944 | 36.5% | 19.3% | 34.6% | 5.4% |
| 18 | La Marque | 19,268 | 2,956 | 34.2% | 27.1% | 32.2% | 2.7% |
| 19 | Center | 5,271 | 2,968 | 37.7% | 29.8% | 25.1% | 0.2% |
| 20 | Princeton | 25,229 | 2,975 | 39.4% | 26.9% | 25.8% | 5.6% |
| 21 | Crowley | 19,532 | 2,988 | 38.1% | 23.2% | 31.1% | 2.6% |
| 22 | Marlin | 5,516 | 2,995 | 25.3% | 39.4% | 27.8% | 4.4% |
| 23 | Allen | 110,265 | 3,030 | 47.4% | 12.1% | 12.6% | 21.0% |
| 24 | Addison | 17,290 | 3,036 | 44.1% | 15.7% | 27.8% | 6.5% |
| 25 | Garland | 246,844 | 3,041 | 24.2% | 15.1% | 45.7% | 11.3% |
| 26 | Houston | 2,328,253 | 3,050 | 23.2% | 22.3% | 44.2% | 6.9% |
| 27 | Selma | 11,503 | 3,059 | 35.7% | 22.3% | 35.6% | 2.2% |
| 28 | Sugar Land | 110,016 | 3,061 | 36.5% | 7.3% | 13.3% | 38.5% |
| 29 | Sunnyvale | 8,336 | 3,073 | 46.4% | 10.4% | 14.4% | 24.1% |
| 30 | Texas City | 55,364 | 3,074 | 36.9% | 26.0% | 31.9% | 1.5% |
| 31 | Lacy-Lakeview | 7,274 | 3,087 | 39.7% | 29.6% | 24.8% | 0.8% |
| 32 | Plano | 290,594 | 3,100 | 46.6% | 8.7% | 16.7% | 23.6% |
| 33 | Red Oak | 17,077 | 3,116 | 27.3% | 43.1% | 21.8% | 1.7% |
| 34 | Webster | 12,366 | 3,117 | 44.9% | 16.9% | 27.4% | 7.1% |
| 35 | Dallas | 1,307,930 | 3,120 | 27.6% | 22.9% | 42.6% | 3.8% |
| 36 | Live Oak | 15,984 | 3,122 | 33.4% | 17.4% | 40.8% | 5.7% |
| 37 | Farmers Branch | 36,645 | 3,125 | 35.6% | 8.8% | 40.6% | 11.1% |
| 38 | Iowa Colony | 12,891 | 3,132 | 24.9% | 45.3% | 20.2% | 3.7% |
| 39 | Cibolo | 35,109 | 3,137 | 44.3% | 13.3% | 30.3% | 2.5% |
| 40 | Wharton | 8,724 | 3,139 | 26.2% | 22.0% | 44.0% | 1.3% |
| 40 | Frisco | 219,304 | 3,139 | 45.8% | 9.0% | 12.7% | 28.1% |
| 42 | Richardson | 118,731 | 3,167 | 49.2% | 11.6% | 18.3% | 16.1% |
| 43 | Rowlett | 65,463 | 3,168 | 47.3% | 19.8% | 21.7% | 7.0% |
| 44 | Corsicana | 25,511 | 3,169 | 40.1% | 13.0% | 36.6% | 1.7% |
| 45 | Mesquite | 149,299 | 3,183 | 22.5% | 26.8% | 44.0% | 3.0% |
| 46 | Grand Prairie | 201,883 | 3,189 | 18.7% | 24.8% | 46.6% | 6.9% |
| 47 | Round Rock | 127,786 | 3,190 | 45.9% | 11.0% | 29.7% | 8.1% |
| 48 | Beaumont | 113,279 | 3,198 | 26.3% | 45.2% | 20.8% | 3.8% |
| 49 | Terrell | 20,366 | 3,210 | 37.0% | 23.9% | 35.5% | 0.2% |
| 50 | Coppell | 42,154 | 3,215 | 45.3% | 5.6% | 15.3% | 29.8% |
| 51 | Marshall | 23,825 | 3,240 | 33.8% | 39.7% | 22.5% | 0.3% |
| 51 | Hitchcock | 7,563 | 3,240 | 43.1% | 21.2% | 30.3% | 0.5% |
| 53 | Mexia | 6,859 | 3,268 | 31.4% | 27.7% | 38.9% | 0.6% |
| 54 | Cleveland | 8,984 | 3,275 | 37.2% | 27.9% | 33.4% | 0.5% |
| 55 | Waco | 143,570 | 3,276 | 44.2% | 19.3% | 30.6% | 2.1% |
| 56 | Wylie | 60,334 | 3,291 | 51.1% | 14.5% | 17.7% | 11.3% |
| 57 | Navasota | 8,542 | 3,294 | 36.4% | 24.3% | 37.1% | 0.0% |
| 58 | Lufkin | 34,251 | 3,295 | 42.4% | 18.3% | 33.8% | 1.8% |
| 59 | Duncanville | 39,683 | 3,318 | 22.1% | 29.3% | 44.3% | 1.3% |
| 60 | McKinney | 210,600 | 3,323 | 51.5% | 12.1% | 17.2% | 14.4% |
| 61 | Tyler | 109,215 | 3,326 | 47.5% | 22.2% | 23.7% | 2.7% |
| 62 | Windcrest | 5,820 | 3,344 | 41.9% | 8.7% | 38.1% | 7.1% |
| 63 | Schertz | 44,050 | 3,348 | 44.6% | 11.9% | 34.5% | 2.1% |
| 64 | Mansfield | 77,510 | 3,348 | 49.3% | 23.7% | 17.8% | 4.4% |
| 65 | Port Arthur | 55,828 | 3,353 | 15.8% | 41.9% | 36.4% | 4.5% |
| 66 | Jacksonville | 14,325 | 3,357 | 40.9% | 20.4% | 35.5% | 0.4% |
| 67 | Austin | 979,539 | 3,379 | 47.0% | 7.3% | 31.9% | 9.0% |
| 68 | Copperas Cove | 37,947 | 3,383 | 51.2% | 13.0% | 22.0% | 2.1% |
| 69 | Palestine | 19,136 | 3,393 | 45.8% | 26.7% | 24.0% | 0.1% |
| 70 | Huntsville | 47,864 | 3,399 | 48.1% | 22.5% | 23.7% | 1.5% |
| 71 | Brenham | 18,641 | 3,402 | 49.1% | 19.8% | 24.0% | 2.1% |
| 72 | Bryan | 87,939 | 3,406 | 38.3% | 15.7% | 41.0% | 1.5% |
| 73 | Celina | 34,268 | 3,409 | 53.1% | 9.1% | 14.2% | 16.7% |
| 74 | Leander | 74,067 | 3,410 | 50.6% | 6.2% | 24.0% | 14.8% |
| 75 | Kennedale | 9,439 | 3,420 | 51.4% | 16.5% | 21.2% | 4.3% |
| 76 | Richmond | 12,582 | 3,436 | 22.9% | 22.1% | 49.0% | 4.6% |
| 77 | Kilgore | 13,470 | 3,439 | 49.5% | 14.0% | 26.9% | 0.8% |
| 78 | Fulshear | 34,868 | 3,441 | 52.2% | 4.0% | 18.2% | 17.7% |
| 79 | Crockett | 6,364 | 3,455 | 39.6% | 40.1% | 16.2% | 0.8% |
| 80 | Gatesville | 16,228 | 3,465 | 49.9% | 15.6% | 26.4% | 1.3% |
| 81 | Jersey Village | 7,817 | 3,474 | 51.7% | 14.9% | 22.9% | 7.1% |
| 82 | Rusk | 5,477 | 3,476 | 48.5% | 28.6% | 17.1% | 0.8% |
| 83 | Hutto | 35,483 | 3,486 | 48.0% | 10.7% | 32.1% | 2.4% |
| 84 | Nacogdoches | 32,197 | 3,489 | 49.4% | 24.7% | 20.7% | 1.0% |
| 85 | Giddings | 5,151 | 3,507 | 42.6% | 15.7% | 37.9% | 0.0% |
| 86 | Commerce | 9,383 | 3,512 | 51.0% | 20.6% | 21.6% | 2.3% |
| 87 | Lavon | 6,498 | 3,518 | 54.0% | 8.5% | 20.7% | 7.8% |
| 88 | The Colony | 45,454 | 3,520 | 53.5% | 9.9% | 21.2% | 8.0% |
| 89 | Sealy | 7,053 | 3,527 | 38.1% | 9.8% | 44.2% | 3.4% |
| 90 | Venus | 6,745 | 3,529 | 46.0% | 16.6% | 33.6% | 0.4% |
| 91 | Athens | 13,200 | 3,537 | 48.3% | 13.1% | 31.8% | 2.9% |
| 92 | Longview | 82,923 | 3,545 | 51.4% | 20.1% | 21.8% | 1.6% |
| 93 | Haltom City | 45,767 | 3,547 | 39.1% | 5.3% | 43.7% | 8.9% |
| 94 | Forney | 31,532 | 3,565 | 51.7% | 19.3% | 22.4% | 2.9% |
| 94 | Elgin | 11,563 | 3,565 | 33.0% | 16.5% | 46.9% | 0.3% |
| 96 | Galveston | 53,424 | 3,573 | 49.8% | 15.0% | 29.3% | 2.8% |
| 97 | Seagoville | 19,352 | 3,591 | 25.6% | 17.1% | 51.3% | 0.4% |
| 98 | Vernon | 9,848 | 3,613 | 48.8% | 6.4% | 33.6% | 3.9% |
| 99 | Fate | 22,884 | 3,619 | 49.5% | 11.0% | 32.0% | 3.1% |
| 99 | Saginaw | 24,970 | 3,619 | 45.3% | 10.5% | 38.0% | 3.2% |
Source: U.S. Census ACS 2020-2024. 372 cities with more than 5,000 residents.
Summary
Summary: Diversity Across Texas
If you’re looking for a scientific breakdown of diversity across Texas, this is an accurate list.
The most diverse cities in Texas are Stafford, Euless, Manvel, Pearland, Missouri City, Lewisville, Little Elm, Killeen, Pflugerville, and Harker Heights.


