If you were to draw a line down the middle of the contiguous United States, you’d find a surprising difference in the diversity of the populous.
So, we did draw that line, determine the diversity of every state in America, and came out surprised.
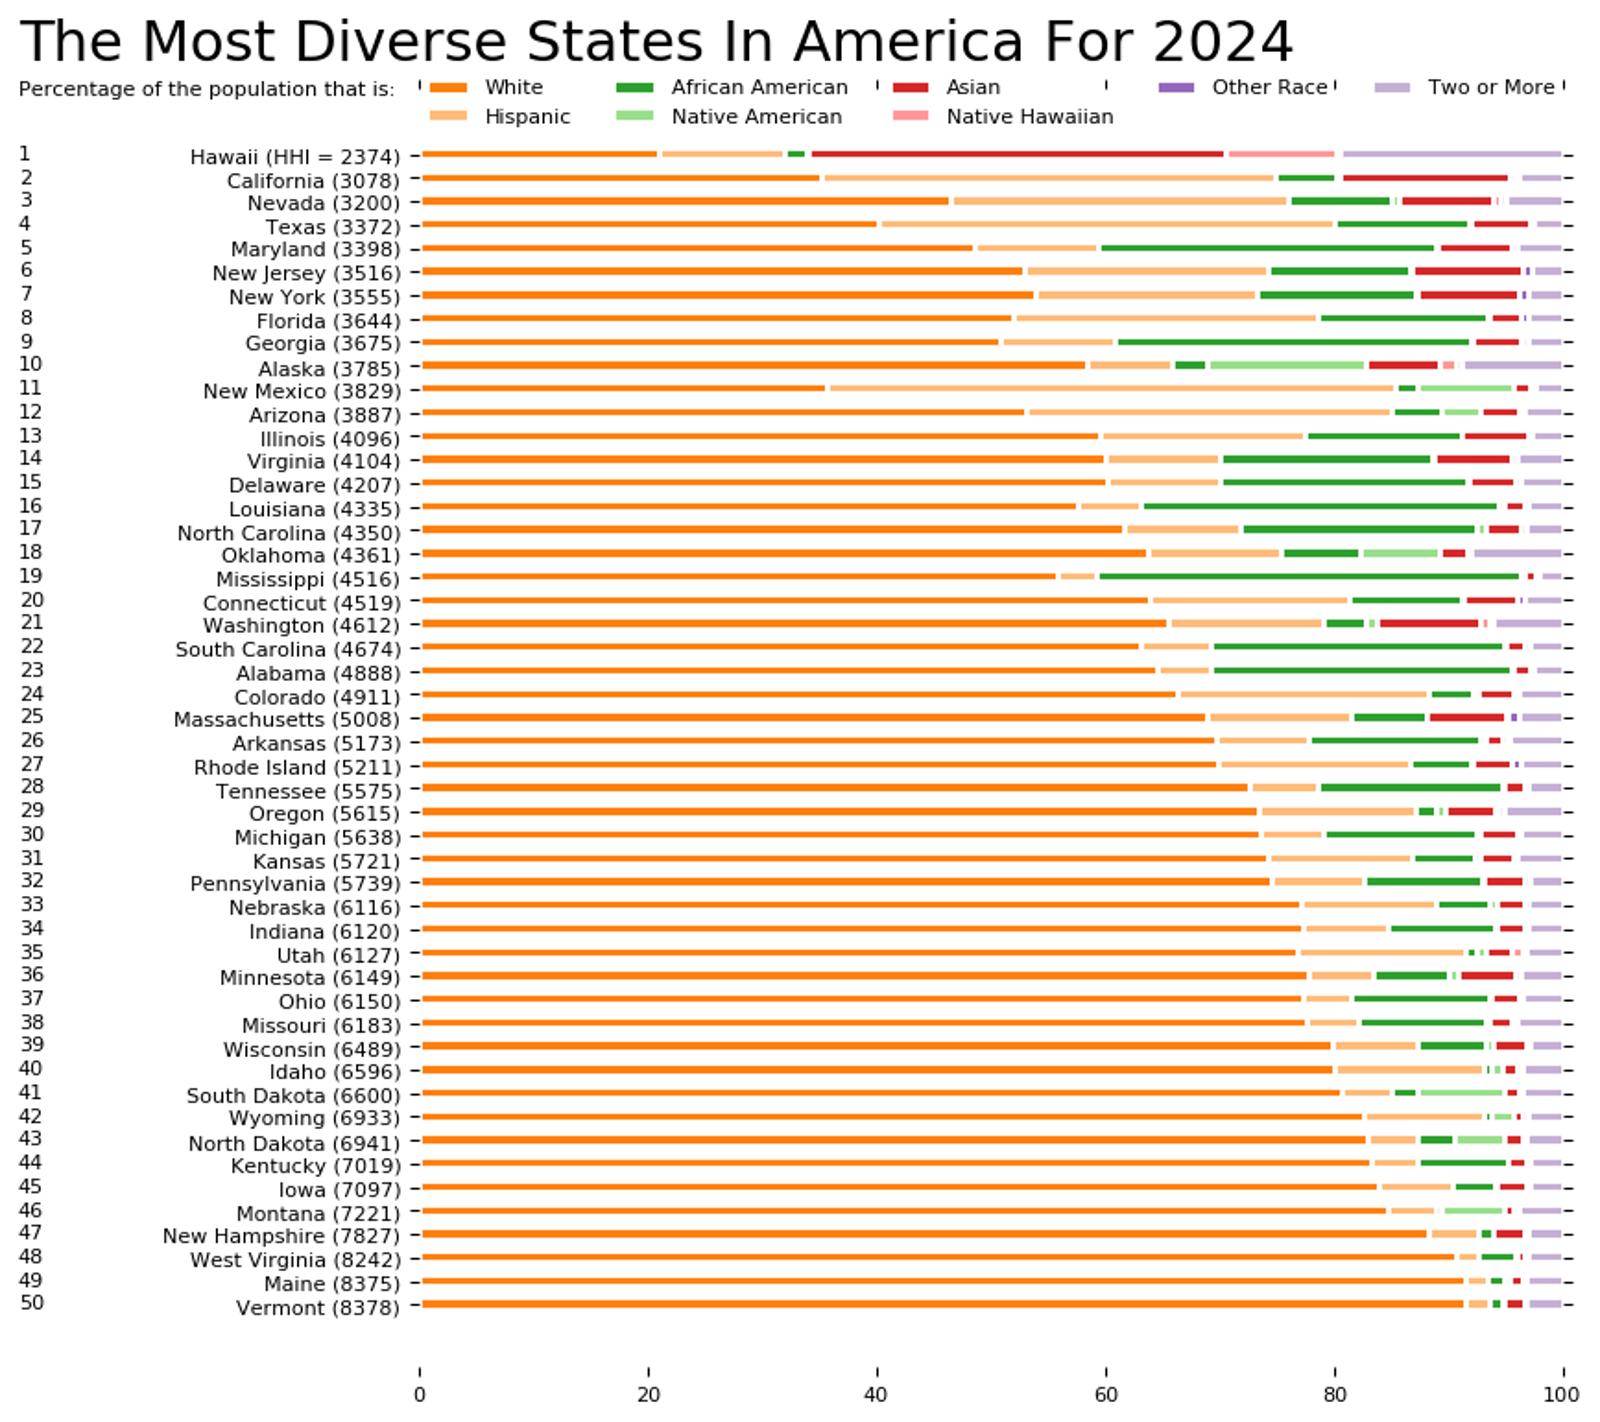
The Southern States of the Union are, with some exceptions, a lot more diverse than the Northern States. The single most diverse state? That would be Hawaii, followed in a distant second by California. Using the Herfindahl-Hirschman Index (HHI), a standard measure of inequality, we ranked each state from most diverse to least diverse.
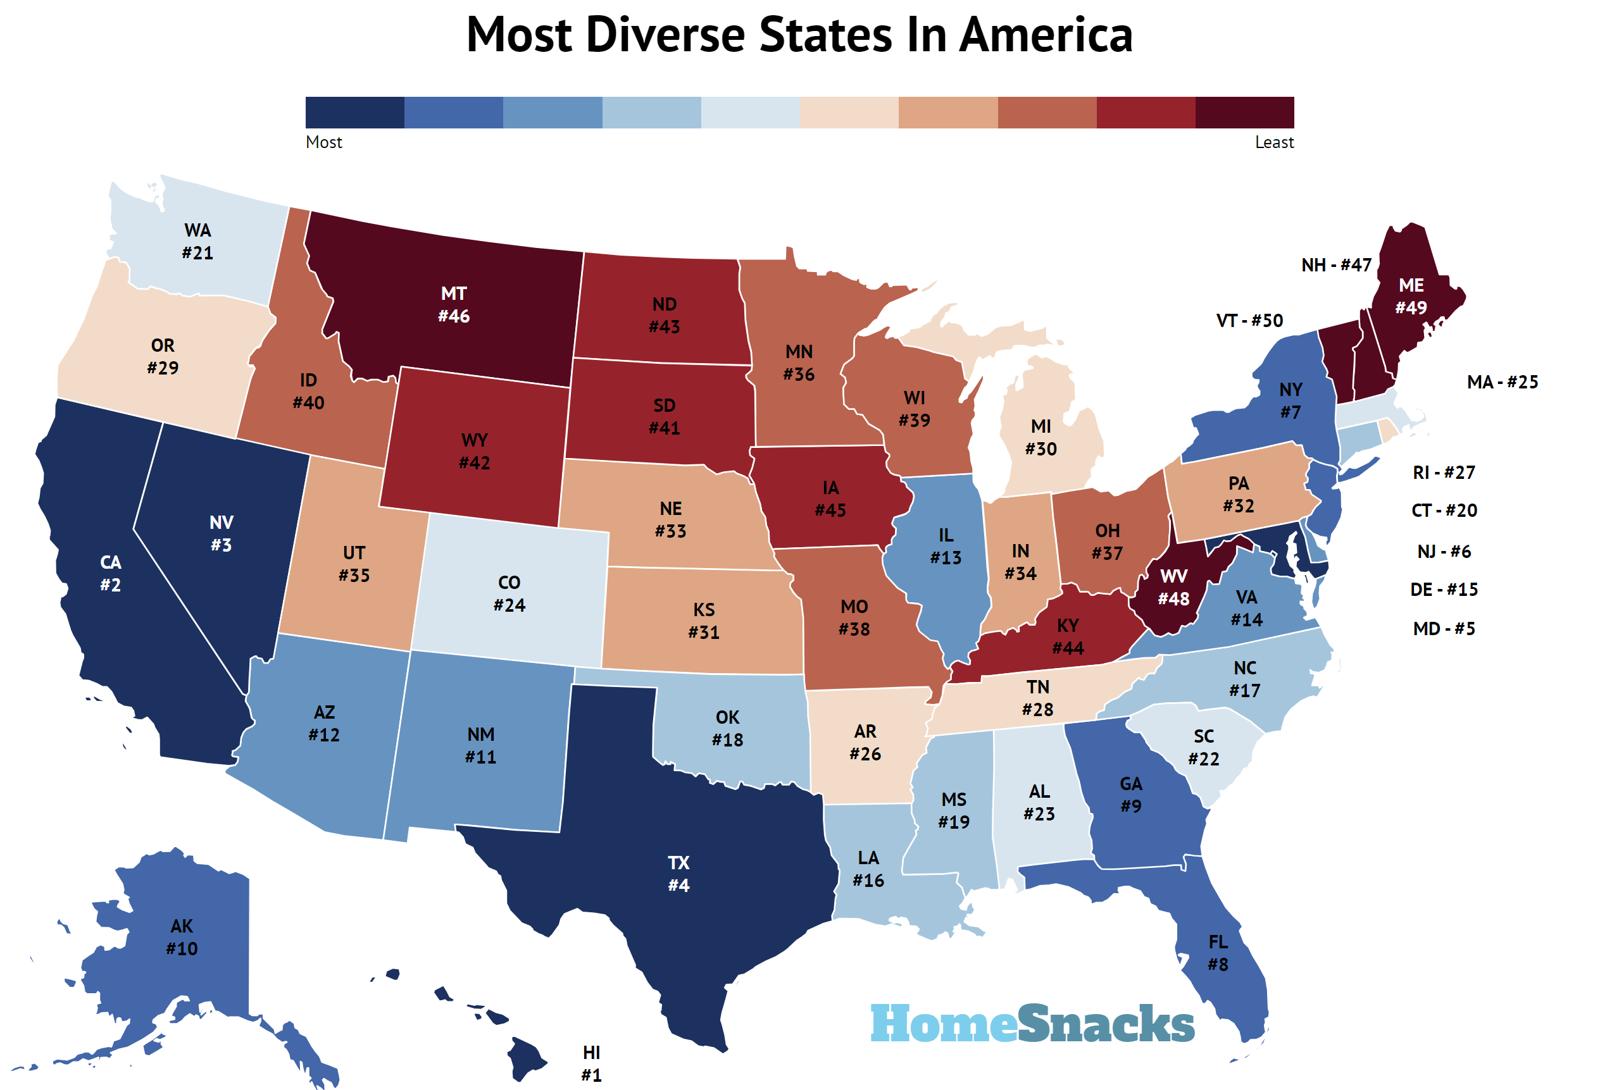
Table Of Contents: Top Ten | Methodology | Table
The Most Diverse States In The US For 2026
The Least Diverse States In The US For 2026
We found it interesting that Texas is such a staunchly Republican state given its level of diversity. Its diversity is a major reason why many pundits believe Texas will soon go blue.
But enough about politics, let’s take a dive into the science behind the maps and graphs.
For more reading about America, check out:
The 10 Most Diverse States In America For 2026
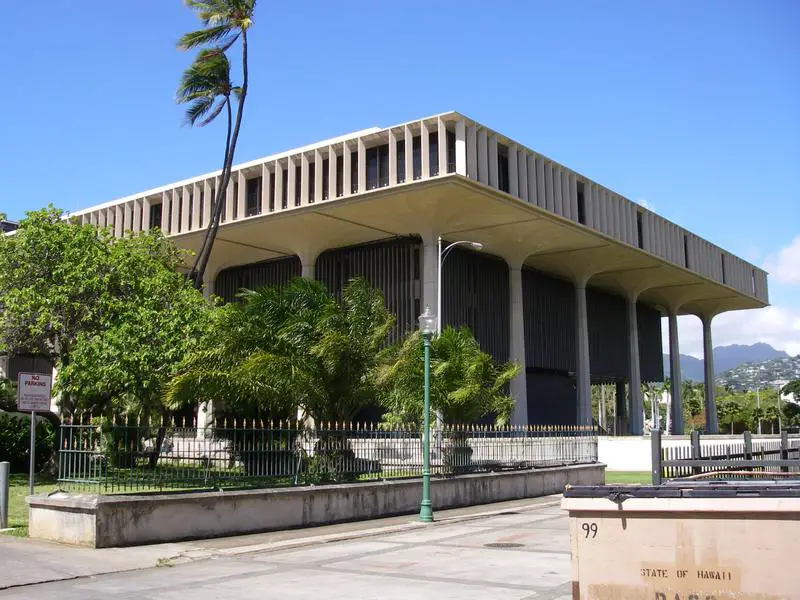
1. Hawaii
Hawaii takes the diversity cake. Look at these numbers: 36.39% Asian, 24% mixed, 20.92% white, 9.94% Hispanic, 10% Native Hawaiian or Islander and 2% black. There’s also a few Native Americans here too.
Hawaii is interestingly the third most economically diverse state, too – meaning there’s a big gap between the rich and the poor here. And 3% of people in Honolulu are Buddhist. If you’ve ever been to Hawaii, you’d know, this is also a melting pot of cuisine. There’s poke, poi, pineapple, spam musubi, laulau, plate lunch, and of course, shaved ice.
Population: 1,445,235
Rank Last Year: 1 (No Change)
HHI: 2,394
More On Hawaii: Rent
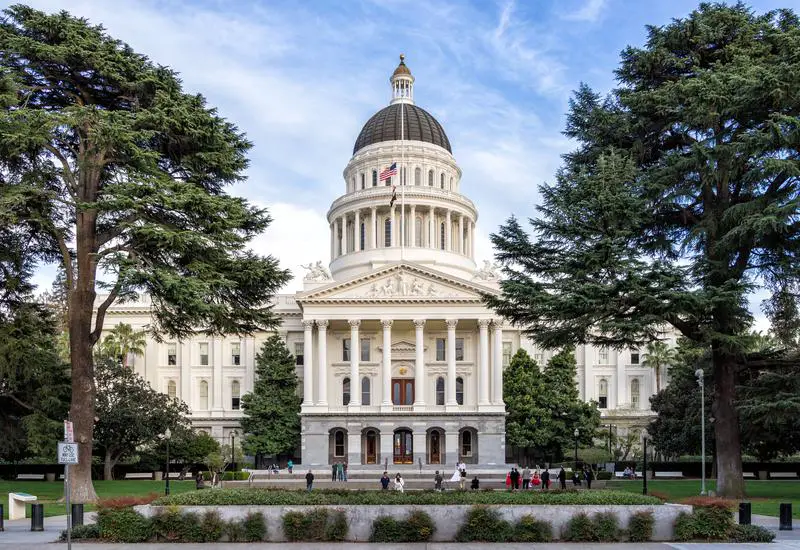
2. California
Of course, California is diverse. And at the rate things are currently going, California will be atop this list at some point soon. California is currently 33.77% white, 40.16% Hispanic, 15.29% Asian, and 5.19% African American. When you look at this ethnic mix, you can understand why there are more various languages spoken in California households than any other place in America.
While most people assume California’s diversity stems from a hispanic population boom, in fact, it’s the Asian population that’s stemming a majority of the growth here. As such, California has the nation’s highest Chinese population, too. Overall, as you can imagine, California has the most foriegn born residents. 27% of California’s population was born outside of the US.
In West Virginia, that number is 1%.
Population: 39,287,377
Rank Last Year: 2 (No Change)
HHI: 3,033
More On California: Rent
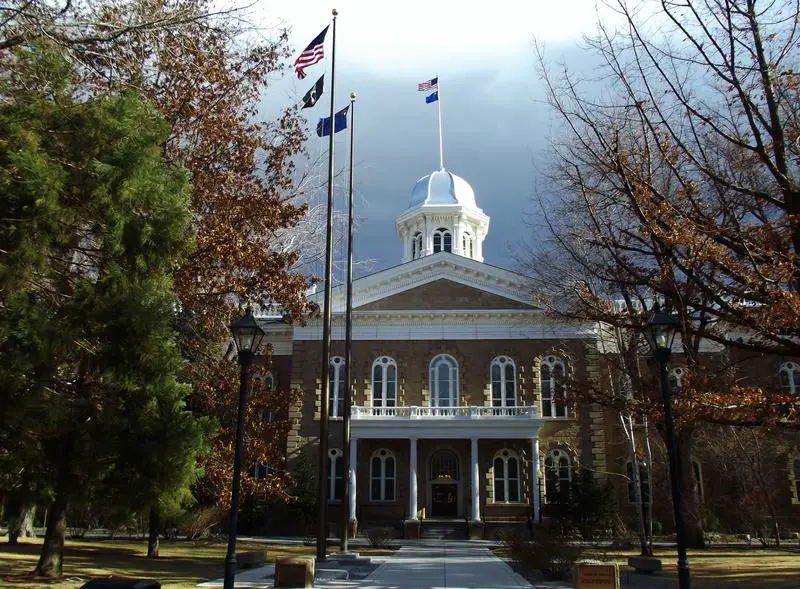
3. Nevada
What makes Nevada such a diverse place? It’s less than half white for starters. (Hispanics make up nearly a third of the population, and African American and Asian populations are nearly 10%.)
The Las Vegas metro makes up a quarter of this state’s population. Due to the city’s international flair, it’s a big draw for people from all over the world. It has a large Phillipino population, and 5% of Vegas” population is of mixed descent. We won a little bit of money while we were in Vegas, but we lost it all again. Same as it ever was.
Population: 3,184,612
Rank Last Year: 3 (No Change)
HHI: 3,077
More On Nevada: Rent
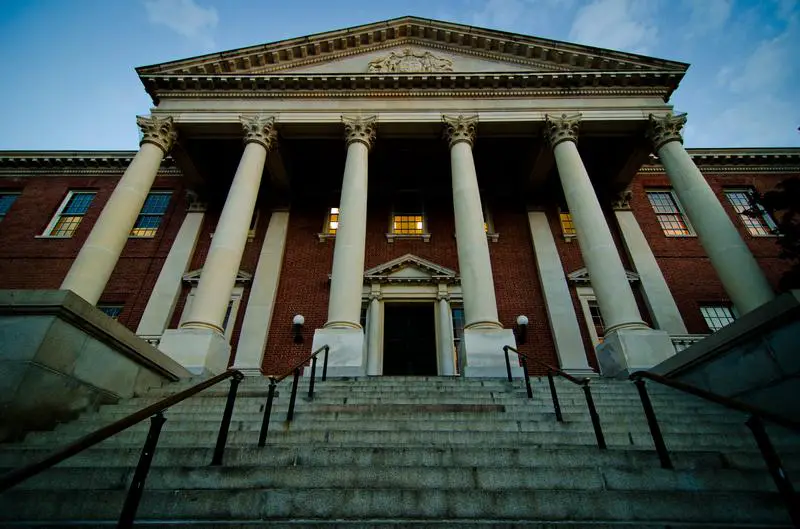
4. Maryland
It’s time to take a quick flight to Maryland. Maryland is the second least white state we’ll see, after New Mexico. Here, half the population is white. About a third are African American, ~10% are Hispanic, and ~7% are Asian.
Baltimore is the big reason Maryland has such a high black population. Baltimore is 63% black, which makes it the 5th most african americanest city in the country. Going back to 1940, Baltimore was 80% white. That’s a big change.
Maryland also ranks 4th in terms of income diversity. There’s a lot of really rich and really poor people here.
Population: 6,206,011
Rank Last Year: 4 (No Change)
HHI: 3,228
More On Maryland: Rent
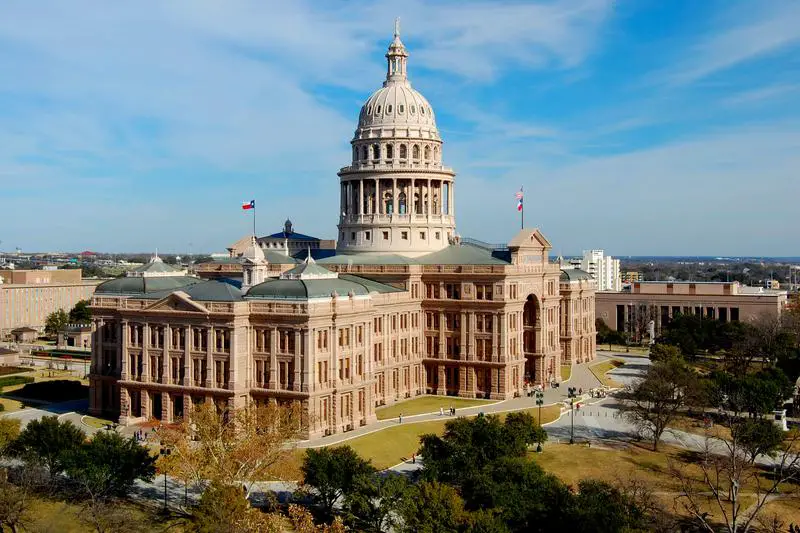
5. Texas
Here in Texas, it’s pretty much a white or Hispanic state. 39.12% are white, 39.72% are Hispanic, and the other 20% pretty much black or Asian). Of course, over time, Texas has become very hispanic. Over the last few years, the white birth rate in Texas has shrunk to 33%, and the hispanic birth rate has risen, and is now 47%. But, across America, the birth rate for Hispanic women has fallen by 31 percent in the last ten years. That’s because now, 2 in 3 Hispanic women were born in the US.
Today’s American-born Hispanic women are less likely to be poor and more likely to be educated than their immigrant mothers and grandmothers, and are more often delaying childbearing so they can finish school and start careers. Hence, in many areas of America, the Hispanic population boom is slowing.
Population: 30,188,424
Rank Last Year: 5 (No Change)
HHI: 3,290
More On Texas: Rent
6. New Jersey
Here in the Garden State, god planted a lot of different seeds. The racial breakdown is as such, which shows there are actually four major races here, since the Asian population stands at 10%.
New Jersey has America’s largest Italian population. There are also a lot of Jews in New Jersey. 6% of Jew Nersians are of the Jewish American population, good for the 3rd highest population in the US
Population: 9,343,809
Rank Last Year: 6 (No Change)
HHI: 3,361
More On New Jersey: Rent

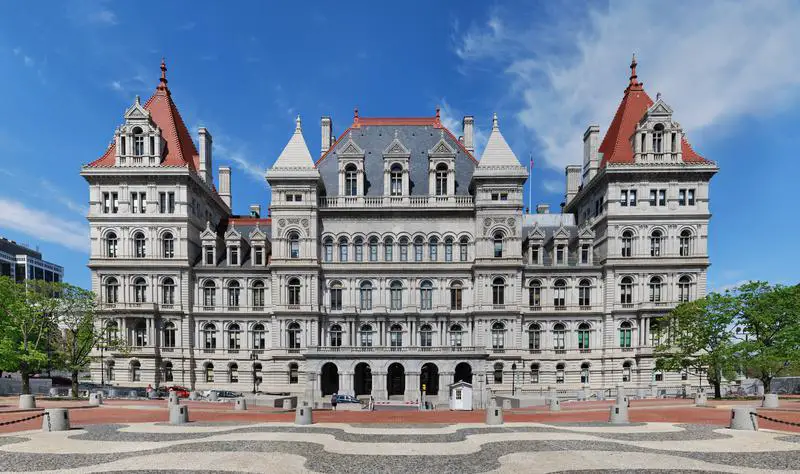
7. New York
Of course New York is one of the most diverse states. This chart shows just over half of the population is white, and its about 20% Hispanic, 18% black, and nearly 10% Asian. Notice New York is also 2.6% mixed race, which is really high. New York is home to the nation’s largest Dominican population, too.
But New York City alone is what really makes this state so diverse in many ways. Within New York City there are more racial, ethnic and cultural differences than anywhere else in the US. Another interesting fact: 10% of New York City are either Muslims, Hindus, Buddhists or Jewish.
Population: 19,852,366
Rank Last Year: 7 (No Change)
HHI: 3,452
More On New York: Rent
8. Georgia
As we come in for a landing, we realize where we are, and this is quite a surprise. We’re in Georgia. But when you look at the numbers, it makes sense. Here’s why: In the United States, the racial makeup is as follows: 60% white alone, 18% hispanic, 13% black, 6% asian, and 1% native american. And some other smaller races.
In Georgia, the racial composition is quite different. Here, the African American population is very high – at 30.73%. The White population here is 49.12% and hispanics make up almost 11.01%.
Now, let’s compare that to our least diverse state in America, Maine, where it’s over 90% white. A real big difference.
Population: 10,940,407
Rank Last Year: 8 (No Change)
HHI: 3,514
More On Georgia: Rent

9. Florida
Next we pull into Miami International Airport, and Florida, our ninth most diverse state in the union.
In Georgia, it’sthe black population that made it diverse, in Florida, it’s the hispanic and latino population which makes it so varied here. Florida is 50.42% white, 27.42% hispanic and 14.63% African American. That’s a racial stew. Plus, Florida has the nation’s largest Cuban population, which make up 7% of the state’s total population. That’s a lot.
Because of Florida’s high elderly population, it ranks first in the US for generational diversity – meaning the gap between the young and old is the biggest in Florida. That makes for some interesting conversations, I’m sure.
Population: 22,416,077
Rank Last Year: 9 (No Change)
HHI: 3,531
More On Florida: Rent
10. Alaska
Population: 735,706
Rank Last Year: 11 (Up 1)
HHI: 3,715
More On Alaska: Rent

How We Determined The Most Diverse States In The United States For 2026?
We decided to look at racial diversity across America using Saturday Night Science and the most recently available Census data — the 2020-2024 American Community Survey data from the US Census. Specifically, we looked at table B03002: HISPANIC OR LATINO ORIGIN BY RACE. Here are the actual categories as defined by the Census:
- White alone*
- Black or African American alone*
- American Indian and Alaska Native alone*
- Asian alone*
- Native Hawaiian and Other Pacific Islander alone*
- Some other race alone*
- Two or more races*
- Hispanic or Latino
We then calculated the HHI for each state by taking the percent of each of the above for the state, squaring them, and then adding it together. This left us with scores ranging from 2,394 (Hawaii) to 8,117 (Vermont).
Finally, we ranked each state based on the HHI with a lower score being more diverse than a high score. Hawaii took the distinction of being the most diverse, while Vermont was the least diverse state in America.
We updated this report for 2026. This report is our eleventh time ranking the most diverse states in the United States.
Summary: The Most Diverse States For 2026
After measuring the HHI of every state, these states came out on top with Hawaii as being the state that is the most diverse.
The most diverse states in the United States are Hawaii, California, Nevada, Maryland, Texas, New Jersey, New York, Georgia, Florida, and Alaska.
The least diverse states in the United States are Vermont, Maine, West Virginia, New Hampshire, Montana, Iowa, Wyoming, North Dakota, Kentucky, and South Dakota.
For more reading, check out:
Detailed List Of The Most Diverse States In The US For 2026
| Rank | State | HHI |
|---|---|---|
| 1 | Hawaii | 2,394 |
| 2 | California | 3,033 |
| 3 | Nevada | 3,077 |
| 4 | Maryland | 3,228 |
| 5 | Texas | 3,290 |
| 6 | New Jersey | 3,361 |
| 7 | New York | 3,452 |
| 8 | Georgia | 3,514 |
| 9 | Florida | 3,531 |
| 10 | Alaska | 3,715 |
| 11 | New Mexico | 3,725 |
| 12 | Arizona | 3,808 |
| 13 | Virginia | 3,929 |
| 14 | Illinois | 3,949 |
| 15 | Delaware | 3,995 |
| 16 | Louisiana | 4,108 |
| 17 | North Carolina | 4,156 |
| 18 | Oklahoma | 4,195 |
| 19 | Connecticut | 4,301 |
| 20 | Washington | 4,351 |
| 21 | Mississippi | 4,390 |
| 22 | South Carolina | 4,506 |
| 23 | Alabama | 4,719 |
| 24 | Massachusetts | 4,733 |
| 25 | Colorado | 4,751 |
| 26 | Arkansas | 4,880 |
| 27 | Rhode Island | 5,000 |
| 28 | Tennessee | 5,355 |
| 29 | Oregon | 5,369 |
| 30 | Michigan | 5,473 |
| 31 | Kansas | 5,531 |
| 32 | Pennsylvania | 5,540 |
| 33 | Indiana | 5,859 |
| 34 | Utah | 5,861 |
| 35 | Nebraska | 5,874 |
| 36 | Minnesota | 5,894 |
| 37 | Ohio | 5,942 |
| 38 | Missouri | 5,993 |
| 39 | Wisconsin | 6,293 |
| 40 | Idaho | 6,378 |
| 41 | South Dakota | 6,460 |
| 42 | Kentucky | 6,749 |
| 43 | North Dakota | 6,750 |
| 44 | Wyoming | 6,751 |
| 45 | Iowa | 6,861 |
| 46 | Montana | 7,060 |
| 47 | New Hampshire | 7,601 |
| 48 | West Virginia | 8,072 |
| 49 | Maine | 8,111 |
| 50 | Vermont | 8,117 |
For more reading about America, check out:
Best Places To Live In America
Most Liberal Cities In America
Best States To Raise A Family In America


