Most Native American places in Tennessee research summary. We used Saturday Night Science to research the Tennessee cities with the highest percentage of Native American residents for 2024. The data comes from the American Community Survey 2018-2022 vintage, which breaks down race by origin.
-
The city with the highest percentage of Native Americans is Bolivar. 2.46% of people in Bolivar are Native Americans.
-
The city with the lowest percentage of Native Americans is East Ridge. 0.00% of people in East Ridge are Native American.
-
The city with the most Native Americans is Nashville. 477 people in Nashville are Native American.
-
The city with the fewest Native Americans is East Ridge. 0 people in East Ridge are Native American.
-
The United States has 1,826,286 Native Americans and is 0.55% Native American.
Table Of Contents: Top Ten | Methodology | Summary | Table
The 10 Cities In Tennessee With The Largest Native American Population For 2024
Which city in Tennessee had the largest Native American population? The place with the largest Native American population in Tennessee for 2024 is Bolivar. 2.46 of Bolivar identify as Native American.
To see where Tennessee ranked as a state on diversity, we have a ranking of the most diverse states in America.
And if you already knew these places were Native American, check out the best places to live in Tennessee or the most diverse places in Tennessee.
Read below to see how we crunched the numbers and how your town ranked.
Cities In Tennessee With The Largest Native American Population For 2024
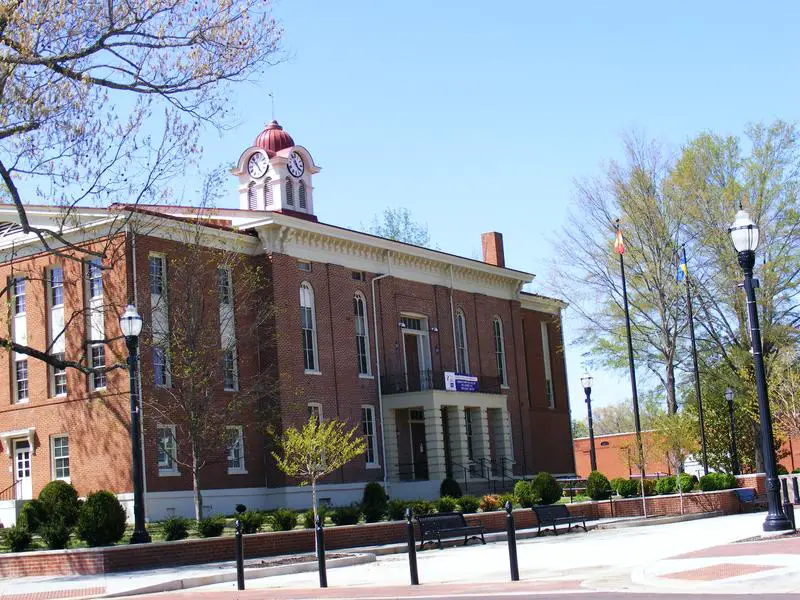
/10
Population: 5,197
# Of Native American Residents: 128
% Native American: 2.46%
More on Bolivar: Data | Crime | Cost Of Living | Real Estate
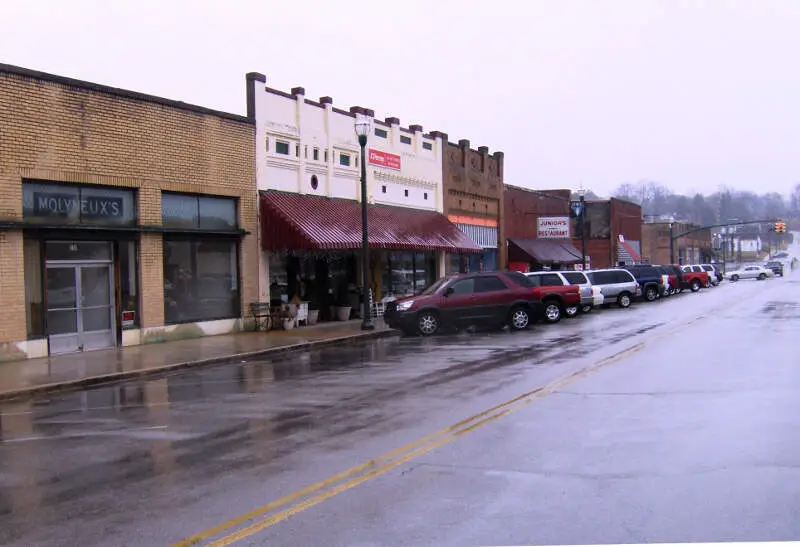
/10
Population: 5,468
# Of Native American Residents: 63
% Native American: 1.15%
More on Rockwood: Data | Crime | Cost Of Living | Real Estate
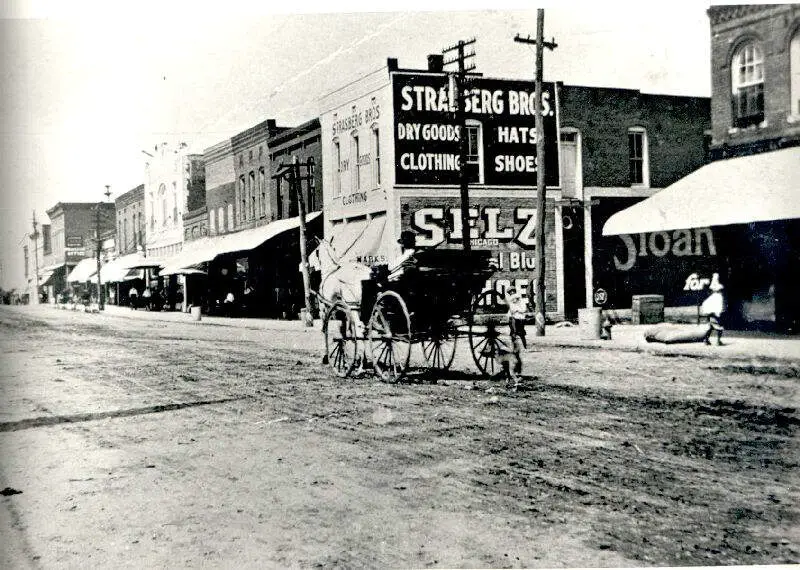
/10
Population: 7,851
# Of Native American Residents: 62
% Native American: 0.79%
More on Humboldt: Data | Crime | Cost Of Living | Real Estate
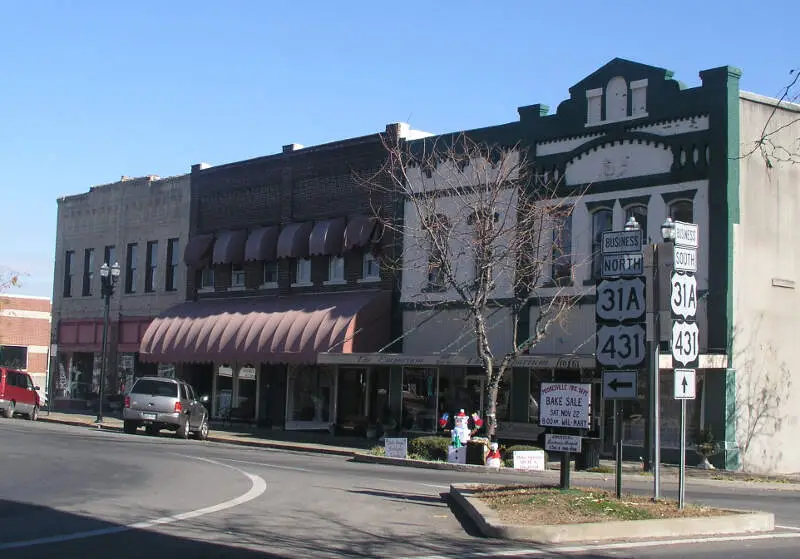
/10
Population: 12,376
# Of Native American Residents: 78
% Native American: 0.63%
More on Lewisburg: Data | Crime | Cost Of Living | Real Estate
/10
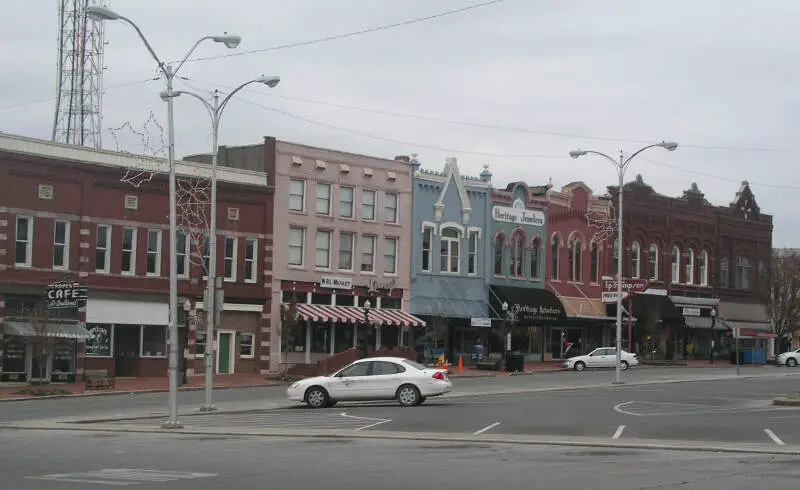
Population: 23,676
# Of Native American Residents: 112
% Native American: 0.47%
More on Shelbyville: Data | Crime | Cost Of Living | Real Estate
/10
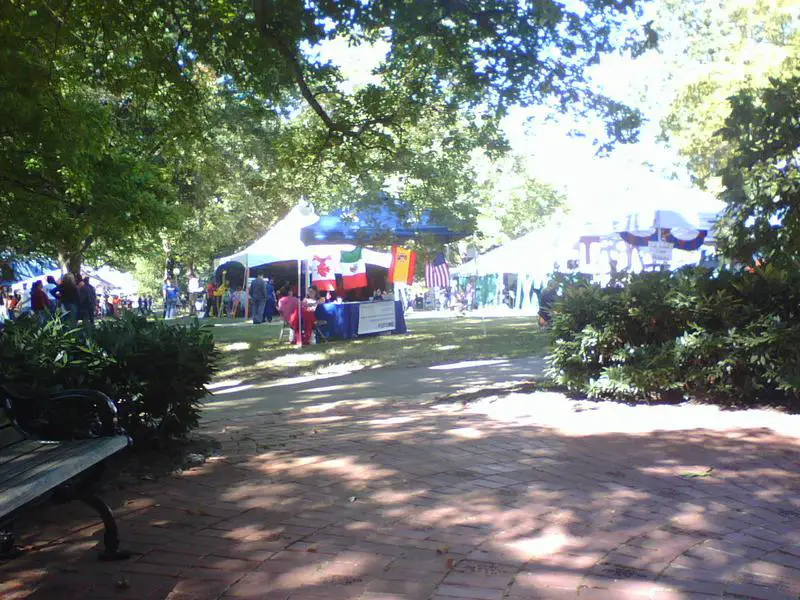
Population: 10,823
# Of Native American Residents: 45
% Native American: 0.42%
More on Martin: Data | Crime | Cost Of Living | Real Estate
/10
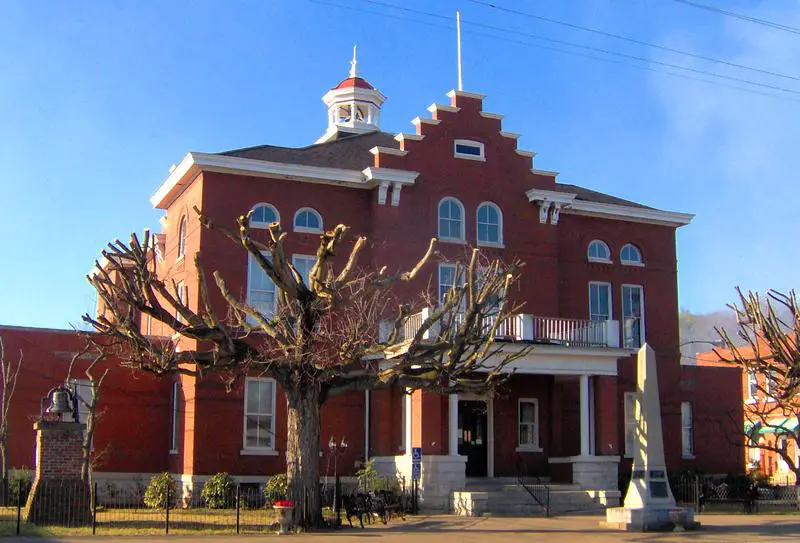
Population: 11,596
# Of Native American Residents: 47
% Native American: 0.41%
More on Hartsville/trousdale County: Data | Real Estate
/10
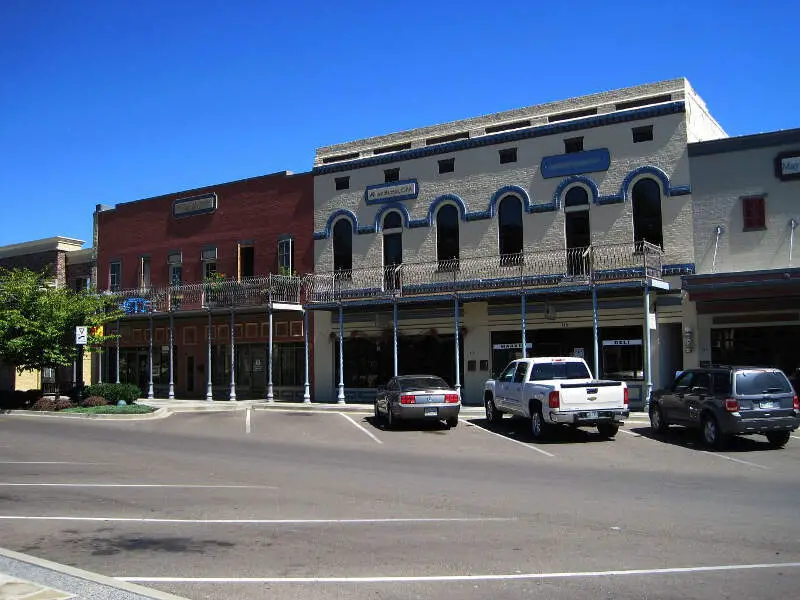
Population: 7,794
# Of Native American Residents: 31
% Native American: 0.4%
More on Ripley: Data | Crime | Cost Of Living | Real Estate
/10
Population: 10,311
# Of Native American Residents: 38
% Native American: 0.37%
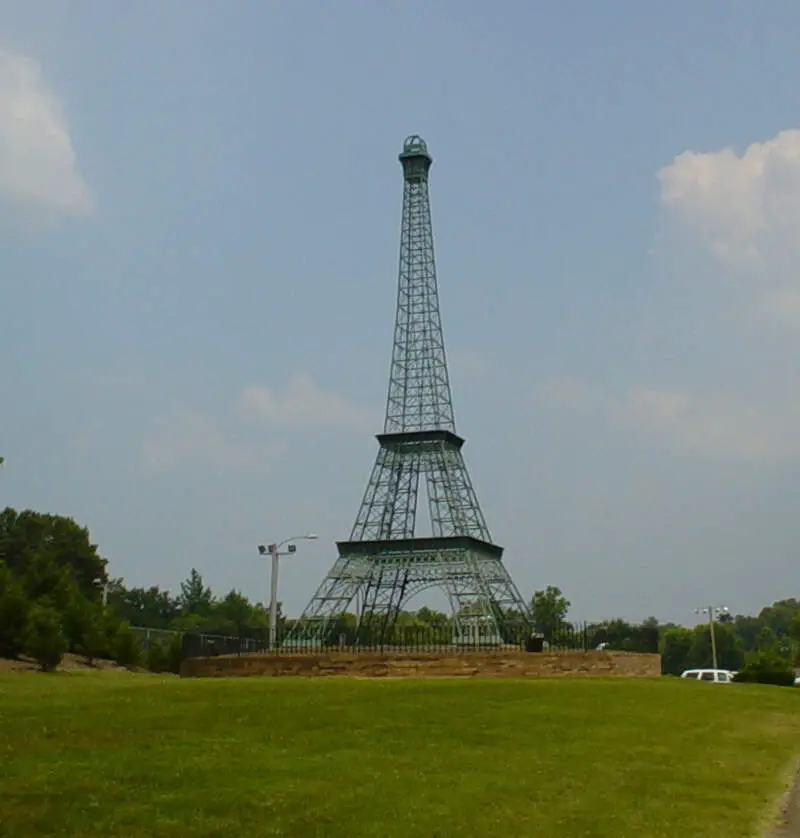
More on Paris: Data | Crime | Cost Of Living | Real Estate
/10
Population: 30,574
# Of Native American Residents: 99
% Native American: 0.32%
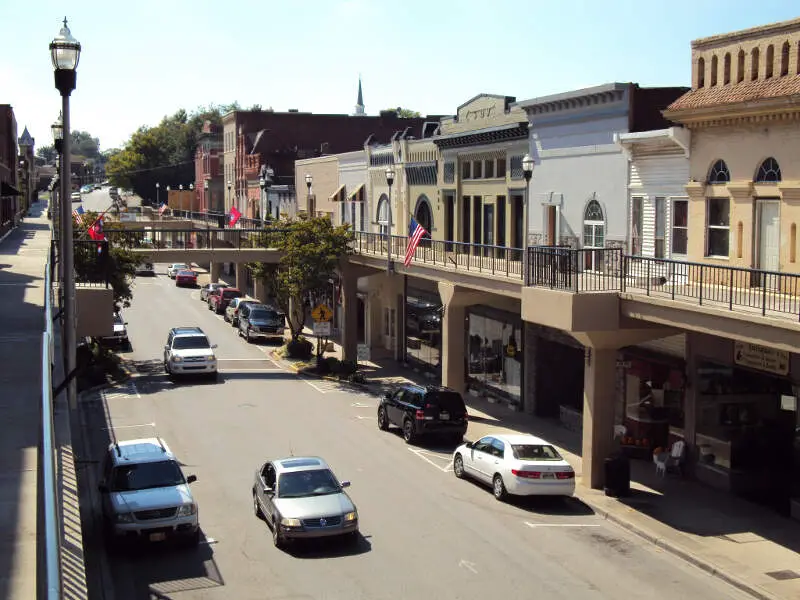
More on Morristown: Data | Crime | Cost Of Living | Real Estate
Methodology: How We Determined The Cities In Tennessee With The Largest Native American Population For 2024
We still believe in the accuracy of data — especially from the Census. So that’s where we went to get the race breakdown across Tennessee.
We used Saturday Night Science to analyze the Census’s most recently available data, the 2018-2022 American Community Survey data.
Specifically, we looked at table B03002: Hispanic OR LATINO ORIGIN BY RACE. Here are the category names as defined by the Census:
- Hispanic or Latino
- White alone*
- Black or African American alone*
- American Indian and Alaska Native alone*
- Asian alone*
- Native Hawaiian and Other Pacific Islander alone*
- Some other race alone*
- Two or more races*
Our particular column of interest here was the number of people identifying as American Indian and Alaska Native alone.
We limited our analysis to places with a population greater than 5,000 people. That left us with 93 cities.
We then calculated the percentage of residents that are American Indian and Alaska Native. The percentages ranked from 2.46 to 0.00.
Finally, we ranked each city based on the percentage of the American Indian and Alaska Native population, with a higher score being more American Indian and Alaska Native than a lower score. Bolivar took the distinction of being the most American Indian and Alaska Native, while East Ridge was the least Native American city.
We updated this article for 2024. This article is our tenth time ranking the cities in Tennessee with the largest Native American population.
Summary: Native American Populations Across Tennessee
If you’re looking for a breakdown of Native American populations across Tennessee according to the most recent data, this is an accurate list.
The most Native American cities in Tennessee are Bolivar, Rockwood, Humboldt, Lewisburg, Shelbyville, Martin, Hartsville/Trousdale County, Ripley, Paris, and Morristown.
If you’re curious enough, here are the least Native American places in Tennessee:
- East Ridge
- Lakeland
- Nolensville
For more Tennessee reading, check out:
- Best Places To Retire In Tennessee
- Safest Places In Tennessee
- Best Places To Raise A Family In Tennessee
Most Native American Places In Tennessee
| Rank | City | Population | Native American Population | % Native American |
|---|---|---|---|---|
| 1 | Bolivar | 5,197 | 128 | 2.46% |
| 2 | Rockwood | 5,468 | 63 | 1.15% |
| 3 | Humboldt | 7,851 | 62 | 0.79% |
| 4 | Lewisburg | 12,376 | 78 | 0.63% |
| 5 | Shelbyville | 23,676 | 112 | 0.47% |
| 6 | Martin | 10,823 | 45 | 0.42% |
| 7 | Hartsville/trousdale County | 11,596 | 47 | 0.41% |
| 8 | Ripley | 7,794 | 31 | 0.4% |
| 9 | Paris | 10,311 | 38 | 0.37% |
| 10 | Morristown | 30,574 | 99 | 0.32% |
| 11 | Clarksville | 167,882 | 408 | 0.24% |
| 12 | Columbia | 42,474 | 95 | 0.22% |
| 13 | Newport | 6,850 | 15 | 0.22% |
| 14 | Portland | 13,177 | 28 | 0.21% |
| 15 | Dickson | 16,051 | 31 | 0.19% |
| 16 | Mcminnville | 13,756 | 26 | 0.19% |
| 17 | Spring Hill | 51,319 | 86 | 0.17% |
| 18 | Gallatin | 44,947 | 74 | 0.16% |
| 19 | Greeneville | 15,458 | 25 | 0.16% |
| 20 | Sevierville | 17,986 | 29 | 0.16% |
| 21 | Union City | 11,068 | 17 | 0.15% |
| 22 | Oak Ridge | 31,535 | 41 | 0.13% |
| 23 | Fayetteville | 7,026 | 9 | 0.13% |
| 24 | Dyersburg | 16,170 | 20 | 0.12% |
| 25 | Greenbrier | 6,954 | 8 | 0.12% |
| 26 | Savannah | 7,206 | 8 | 0.11% |
| 27 | Knoxville | 191,857 | 212 | 0.11% |
| 28 | Millington | 10,558 | 10 | 0.09% |
| 29 | Smyrna | 53,760 | 49 | 0.09% |
| 30 | Lebanon | 39,562 | 36 | 0.09% |
| 31 | Johnson City | 70,720 | 64 | 0.09% |
| 32 | Alcoa | 11,095 | 10 | 0.09% |
| 33 | Cleveland | 47,725 | 42 | 0.09% |
| 34 | Hendersonville | 61,589 | 53 | 0.09% |
| 35 | Athens | 14,091 | 11 | 0.08% |
| 36 | Farragut | 23,795 | 18 | 0.08% |
| 37 | Murfreesboro | 153,487 | 115 | 0.07% |
| 38 | Jackson | 67,993 | 50 | 0.07% |
| 39 | Bristol | 27,307 | 20 | 0.07% |
| 40 | Nashville | 684,103 | 477 | 0.07% |
| 41 | Goodlettsville | 17,500 | 12 | 0.07% |
| 42 | Memphis | 630,027 | 423 | 0.07% |
| 43 | Collegedale | 11,001 | 7 | 0.06% |
| 44 | Maryville | 31,876 | 20 | 0.06% |
| 45 | Bartlett | 57,481 | 35 | 0.06% |
| 46 | Chattanooga | 181,288 | 109 | 0.06% |
| 47 | Elizabethton | 14,375 | 8 | 0.06% |
| 48 | Franklin | 83,630 | 46 | 0.06% |
| 49 | Winchester | 9,450 | 5 | 0.05% |
| 50 | Cookeville | 34,967 | 18 | 0.05% |
| 51 | Collierville | 51,170 | 26 | 0.05% |
| 52 | Clinton | 10,060 | 5 | 0.05% |
| 53 | Lenoir City | 10,291 | 5 | 0.05% |
| 54 | La Follette | 7,349 | 3 | 0.04% |
| 55 | Mount Juliet | 39,525 | 16 | 0.04% |
| 56 | Pulaski | 8,301 | 3 | 0.04% |
| 57 | Kingsport | 55,415 | 16 | 0.03% |
| 58 | Springfield | 18,775 | 5 | 0.03% |
| 59 | La Vergne | 38,553 | 9 | 0.02% |
| 60 | Oakland | 9,139 | 2 | 0.02% |
| 61 | Millersville | 5,818 | 1 | 0.02% |
| 62 | Milan | 8,165 | 1 | 0.01% |
| 63 | Atoka | 10,070 | 0 | 0.0% |
| 64 | Red Bank | 11,919 | 0 | 0.0% |
| 65 | Covington | 8,644 | 0 | 0.0% |
| 66 | White House | 13,305 | 0 | 0.0% |
| 67 | Sweetwater | 6,310 | 0 | 0.0% |
| 68 | Church Hill | 7,016 | 0 | 0.0% |
| 69 | Signal Mountain | 8,833 | 0 | 0.0% |
| 70 | Brownsville | 9,739 | 0 | 0.0% |
| 71 | Soddy-Daisy | 13,091 | 0 | 0.0% |
| 72 | Crossville | 12,099 | 0 | 0.0% |
| 73 | Brentwood | 44,830 | 0 | 0.0% |
| 74 | Tullahoma | 21,107 | 0 | 0.0% |
| 75 | Lawrenceburg | 11,592 | 0 | 0.0% |
| 76 | Pigeon Forge | 6,345 | 0 | 0.0% |
| 77 | Dayton | 7,139 | 0 | 0.0% |
| 78 | Lexington | 7,927 | 0 | 0.0% |
| 79 | Manchester | 12,325 | 0 | 0.0% |
| 80 | Arlington | 14,342 | 0 | 0.0% |
| 81 | Kingston | 5,987 | 0 | 0.0% |
| 82 | Mckenzie | 5,608 | 0 | 0.0% |
| 83 | Jefferson City | 8,391 | 0 | 0.0% |
| 84 | Henderson | 6,326 | 0 | 0.0% |
| 85 | Harriman | 6,000 | 0 | 0.0% |
| 86 | Mount Carmel | 5,486 | 0 | 0.0% |
| 87 | Munford | 6,357 | 0 | 0.0% |
| 88 | Germantown | 41,094 | 0 | 0.0% |
| 89 | Fairview | 9,519 | 0 | 0.0% |
| 90 | Erwin | 6,026 | 0 | 0.0% |
| 91 | Nolensville | 14,444 | 0 | 0.0% |
| 92 | Lakeland | 13,811 | 0 | 0.0% |
| 93 | East Ridge | 22,040 | 0 | 0.0% |
