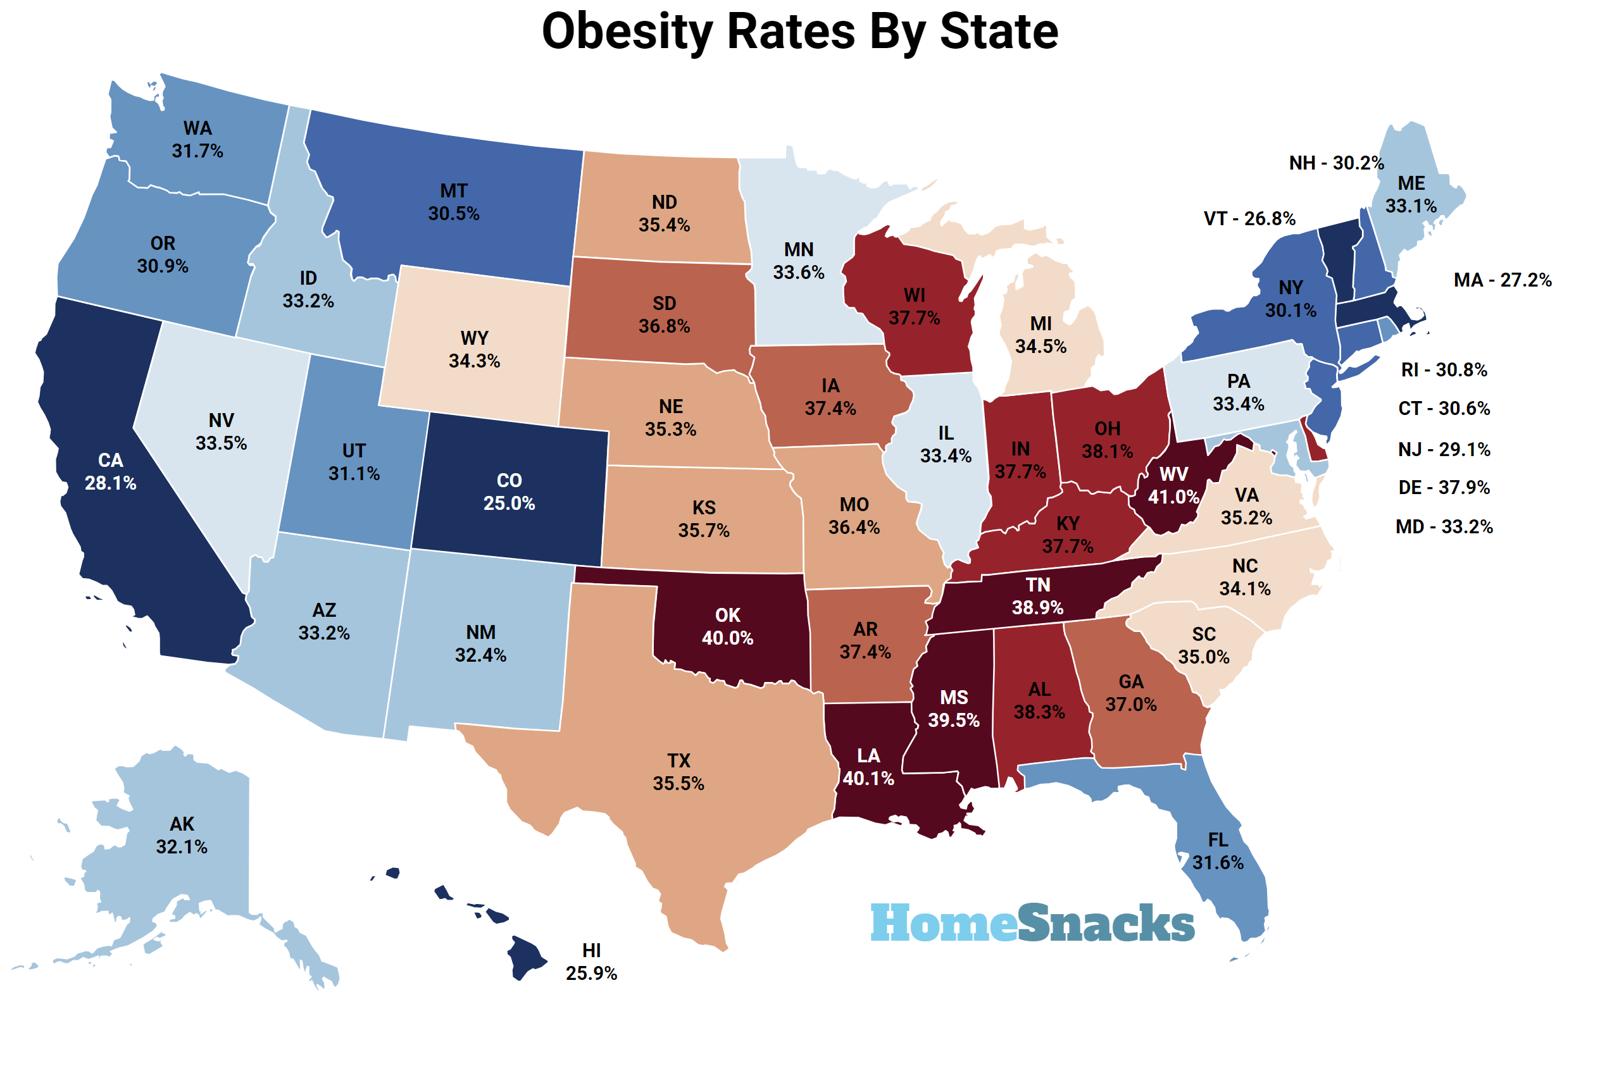
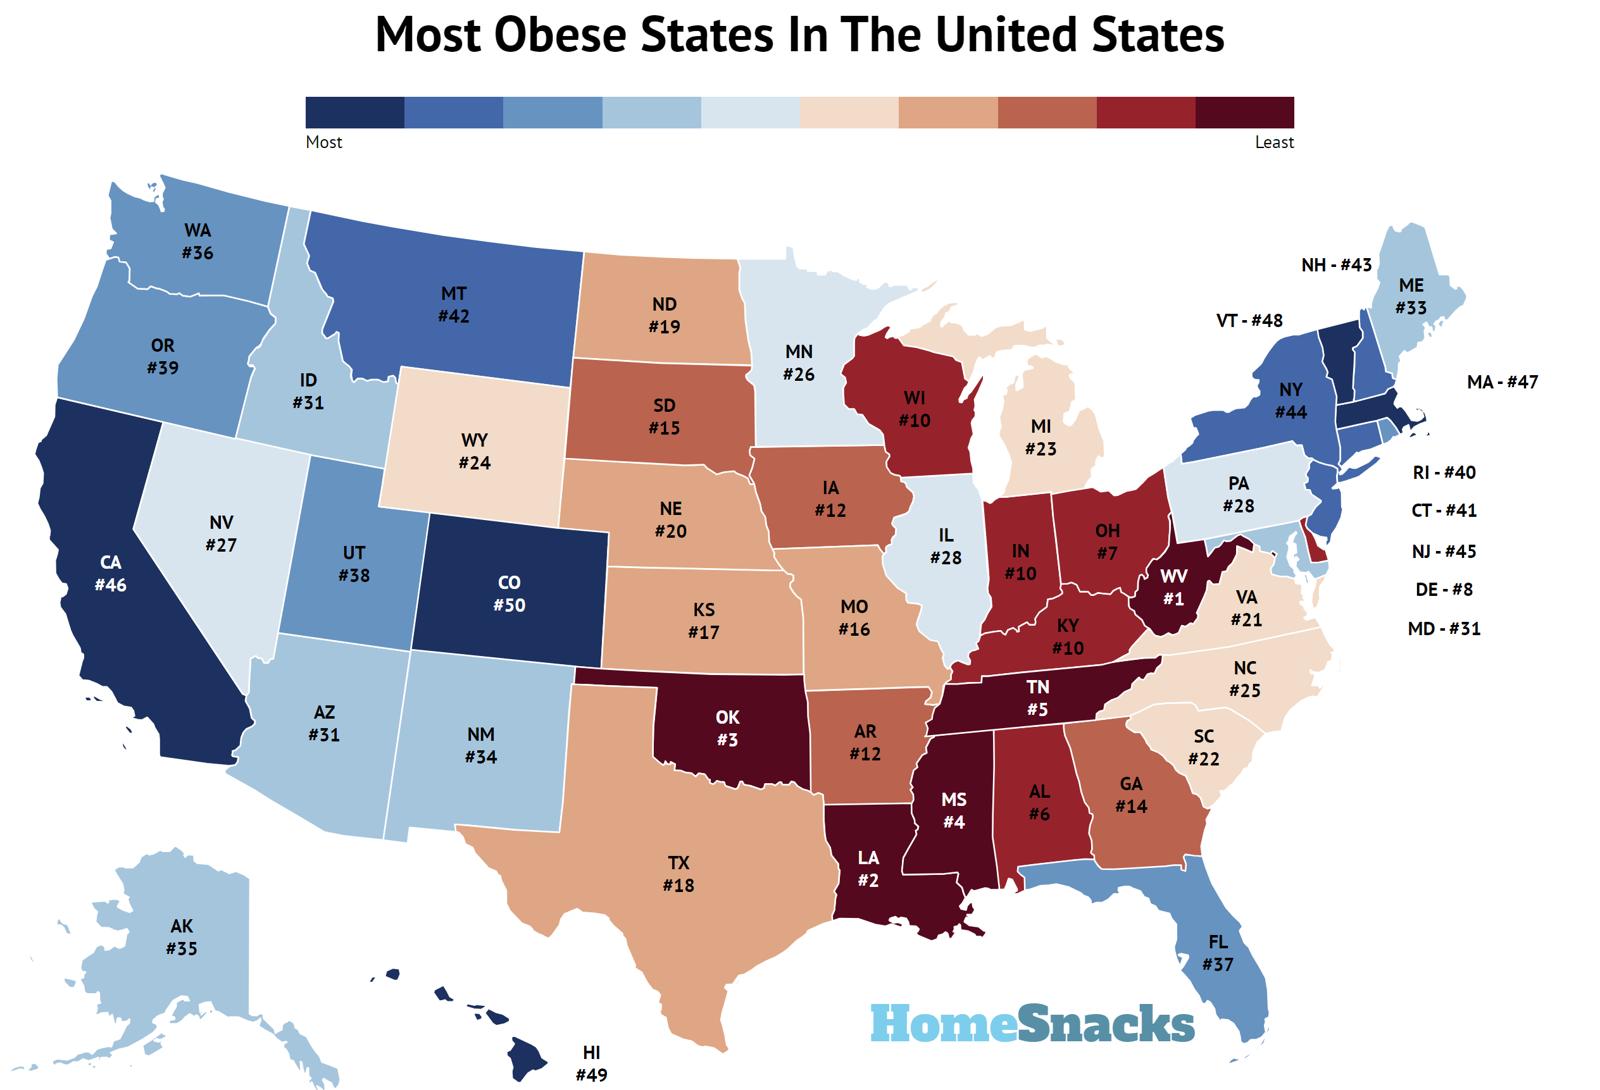
Most obese states in the United States research summary. The data team at HomeSnacks used Saturday Night Science to analyze obesity rate data by state from the CDC. The CDC figures come from telephone surveys conducted as part of the Behavioral Risk Factor Surveillance System. Obese for this report is defined as a body mass index of 30 or higher. Key findings include:
-
West Virginia has the highest obesity rate in the United States — 41.0% obese.
-
Colorado has the lowest obesity rate in the United States — 25.0% obese.
-
The US obesity rate is 33.3%, based on the BRFSS survey.
-
Adults without a high school diploma have the highest prevalence of obesity — 37.6%.
-
Non-Hispanic Blacks face the highest rates of obesity.
Map: Most Obese States In The United States
What is obesity? The US government defines obesity as having a body mass index of over 30. The average American is 5′ 9″, so if you weigh more than 170 pounds, you might be considered a little overweight, and if you weigh more than 203 pounds, you’re technically obese.
All states and territories report obesity rates exceeding 20%, with some regions, such as the Midwest and South, showing notably higher prevalence compared to the Northeast and West. The maps offer valuable insights into the diverse impacts of obesity on different populations, emphasizing the need for tailored strategies to promote health equity.
The data shows significant disparities in obesity prevalence between races. Non-Hispanic Asian adults showed the lowest obesity rates, reporting no instances of obesity rates exceeding 35% in any state. Non-Hispanic Black and American Indian or Alaska Native adults displayed markedly higher rates, with 38 and 33 states, respectively, reporting obesity rates exceeding the 35% threshold.
We also saw a strong correlation between education, age, and obesity. There is a lower prevalence of obesity among individuals with higher education levels and a substantial increase in obesity rates within the middle-aged demographic.
The 10 Most Obese States
Here is a breakdown of the ten states with the highest obesity rates in the United States as a percent:
- West Virginia – 41.0% Obesity Rate
- Louisiana – 40.1% Obesity Rate
- Oklahoma – 40.0% Obesity Rate
- Mississippi – 39.5% Obesity Rate
- Tennessee – 38.9% Obesity Rate
- Alabama – 38.3% Obesity Rate
- Ohio – 38.1% Obesity Rate
- Delaware – 37.9% Obesity Rate
- Wisconsin – 37.7% Obesity Rate
- Kentucky – 37.7% Obesity Rate
The 10 Least Obese States
Here is a breakdown of the ten states with the lowest obesity rates in the United States as a percent:
- Colorado – 25.0% Obesity Rate
- Hawaii – 25.9% Obesity Rate
- Vermont – 26.8% Obesity Rate
- Massachusetts – 27.2% Obesity Rate
- California – 28.1% Obesity Rate
- New Jersey – 29.1% Obesity Rate
- New York – 30.1% Obesity Rate
- New Hampshire – 30.2% Obesity Rate
- Montana – 30.5% Obesity Rate
- Connecticut – 30.6% Obesity Rate
Table: Obesity Rates By State In The United States
| Rank | State | Population | Obesity Rate |
|---|---|---|---|
| 1 | West Virginia | 1,801,049 | 41.0% |
| 2 | Louisiana | 4,657,305 | 40.1% |
| 3 | Oklahoma | 3,948,136 | 40.0% |
| 4 | Mississippi | 2,967,023 | 39.5% |
| 5 | Tennessee | 6,859,497 | 38.9% |
| 6 | Alabama | 4,997,675 | 38.3% |
| 7 | Ohio | 11,769,923 | 38.1% |
| 8 | Delaware | 981,892 | 37.9% |
| 10 | Wisconsin | 5,871,661 | 37.7% |
| 10 | Kentucky | 4,494,141 | 37.7% |
| 10 | Indiana | 6,751,340 | 37.7% |
| 12 | Arkansas | 3,006,309 | 37.4% |
| 12 | Iowa | 3,179,090 | 37.4% |
| 14 | Georgia | 10,625,615 | 37.0% |
| 15 | South Dakota | 881,785 | 36.8% |
| 16 | Missouri | 6,141,534 | 36.4% |
| 17 | Kansas | 2,932,099 | 35.7% |
| 18 | Texas | 28,862,581 | 35.5% |
| 19 | North Dakota | 773,344 | 35.4% |
| 20 | Nebraska | 1,951,480 | 35.3% |
| 21 | Virginia | 8,582,479 | 35.2% |
| 22 | South Carolina | 5,078,903 | 35.0% |
| 23 | Michigan | 10,062,512 | 34.5% |
| 24 | Wyoming | 576,641 | 34.3% |
| 25 | North Carolina | 10,367,022 | 34.1% |
| 26 | Minnesota | 5,670,472 | 33.6% |
| 27 | Nevada | 3,059,238 | 33.5% |
| 28 | Pennsylvania | 12,970,650 | 33.4% |
| 28 | Illinois | 12,821,813 | 33.4% |
| 31 | Maryland | 6,148,545 | 33.2% |
| 31 | Idaho | 1,811,617 | 33.2% |
| 31 | Arizona | 7,079,203 | 33.2% |
| 33 | Maine | 1,357,046 | 33.1% |
| 34 | New Mexico | 2,109,366 | 32.4% |
| 35 | Alaska | 735,951 | 32.1% |
| 36 | Washington | 7,617,364 | 31.7% |
| 37 | Florida | 21,339,762 | 31.6% |
| 38 | Utah | 3,231,370 | 31.1% |
| 39 | Oregon | 4,207,177 | 30.9% |
| 40 | Rhode Island | 1,091,949 | 30.8% |
| 41 | Connecticut | 3,605,330 | 30.6% |
| 42 | Montana | 1,077,978 | 30.5% |
| 43 | New Hampshire | 1,372,175 | 30.2% |
| 44 | New York | 20,114,745 | 30.1% |
| 45 | New Jersey | 9,234,024 | 29.1% |
| 46 | California | 39,455,353 | 28.1% |
| 47 | Massachusetts | 6,991,852 | 27.2% |
| 48 | Vermont | 641,637 | 26.8% |
| 49 | Hawaii | 1,453,498 | 25.9% |
| 50 | Colorado | 5,723,176 | 25.0% |
Methodology: Determining Obesity Rates By State
We used Saturday Night Science to analyze obesity rate data by state from the CDC. The CDC figures come from telephone surveys conducted by the Behavioral Risk Factor Surveillance System. Obese for this report is defined as a body mass index of 30 or higher.
We ranked each state from the highest to the lowest rate of obesity using the survey results. The results showed that the most obese state for 2023 is West Virginia.
Conclusion: Obesity Rate By States
The data from the Behavioral Risk Factor Surveillance System, reveals significant disparities in obesity prevalence among demographic groups and geographic regions. Education, race, and age all play important roles in determining the underlying state of obesity in any given state.


