Allegheny County Summary

Life in Allegheny County research summary. HomeSnacks has been researching the quality of life in Allegheny County over the past eight years using Census data, FBI crime data, cost of living data, and other primary sources. Based on the most recently available data, we found the following about life in Allegheny County:

  • The population in Allegheny County is 1,245,310.

  • The median home value in Allegheny County is $217,423.

  • The median income in Allegheny County is $72,537.

  • The median rent in Allegheny County is $1,050.

  • The unemployment rate in Allegheny County is 4.9%.

  • The poverty rate in Allegheny County is 11.1%.

  • The average high in Allegheny County is 67.9° and there are 113.8 inches of rainfall annually.

Cities & Towns in Allegheny County

List Of Cities & Towns in Allegheny County

Pittsburgh, PA Population 303,843

Alcoa , PA Population 33,275

Alden , PA Population 28,517

Plum, PA Population 27,032

Allison Park, PA Population 22,701

Baldwin, PA Population 21,266

West Mifflin, PA Population 19,506

McKeesport, PA Population 17,749

Franklin Park, PA Population 15,305

Whitehall, PA Population 14,909

Wilkinsburg, PA Population 14,340

Carnot-Moon, PA Population 13,345

Jefferson Hills, PA Population 12,296

Munhall, PA Population 10,738

Brentwood, PA Population 9,982

Glenshaw, PA Population 9,418

Swissvale, PA Population 8,588

Pleasant Hills, PA Population 8,456

Castle Shannon, PA Population 8,283

Bellevue, PA Population 8,236

Dormont, PA Population 8,199

Carnegie, PA Population 8,067

White Oak, PA Population 7,585

Oakmont, PA Population 6,734

West View, PA Population 6,660

Forest Hills, PA Population 6,397

Clairton, PA Population 6,182

Crafton, PA Population 6,044

McKees Rocks, PA Population 5,893

Coraopolis, PA Population 5,510

Fox Chapel, PA Population 5,299

Duquesne, PA Population 5,241

Turtle Creek, PA Population 5,087

Green Tree, PA Population 4,870

Bridgeville, PA Population 4,777

Avalon, PA Population 4,739

Glassport, PA Population 4,439

Tarentum, PA Population 4,328

North Braddock, PA Population 4,320

Sewickley, PA Population 3,873

Port Vue, PA Population 3,673

Etna, PA Population 3,413

Millvale, PA Population 3,377

Springdale, PA Population 3,373

Mount Oliver, PA Population 3,357

Ingram, PA Population 3,351

Trafford, PA Population 3,237

Brackenridge, PA Population 3,214

Sharpsburg, PA Population 3,189

Churchill, PA Population 3,127

Edgewood, PA Population 3,104

Pitcairn, PA Population 3,084

Homestead, PA Population 2,905

Aspinwall, PA Population 2,890

Gibsonia, PA Population 2,876

Bakerstown, PA Population 2,859

Imperial, PA Population 2,736

Verona, PA Population 2,629

Emsworth, PA Population 2,524

McDonald, PA Population 2,263

Liberty borough (Allegheny County), PA Population 2,194

East McKeesport, PA Population 2,074

Greenock, PA Population 1,895

Ben Avon, PA Population 1,878

East Pittsburgh, PA Population 1,866

Rankin, PA Population 1,837

Wilmerding, PA Population 1,834

Braddock, PA Population 1,814

West Homestead, PA Population 1,747

Cheswick, PA Population 1,638

Braddock Hills, PA Population 1,625

Versailles, PA Population 1,620

Bell Acres, PA Population 1,615

Dravosburg, PA Population 1,614

Blawnox, PA Population 1,532

Edgeworth, PA Population 1,520

Oakdale, PA Population 1,459

Elizabeth, PA Population 1,433

Sturgeon, PA Population 1,407

Heidelberg, PA Population 1,254

Bradford Woods, PA Population 1,235

Whitaker, PA Population 1,232

Russellton, PA Population 1,224

Enlow, PA Population 1,205

Clinton, PA Population 1,164

Leetsdale, PA Population 1,125

Lincoln, PA Population 998

Rennerdale, PA Population 955

Curtisville, PA Population 877

Harwick, PA Population 862

Sewickley Heights, PA Population 762

Sewickley Hills, PA Population 697

Bairdford, PA Population 653

Chalfant, PA Population 649

Pennsbury Village, PA Population 633

Noblestown, PA Population 532

Wall, PA Population 526

Rosslyn Farms, PA Population 515

West Elizabeth, PA Population 456

Thornburg, PA Population 454

Glen Osborne, PA Population 444

Ben Avon Heights, PA Population 312

Boston, PA Population 281

Glenfield, PA Population 224

Haysville, PA Population 124

South Park Township, PA Population 0

Upper St. Clair, PA Population 0

Map Of Allegheny County

Allegheny County, PA Weather

  • The average high in Allegheny County is 67.9°.

  • There are 81.68 nice days each year.

  • Expect an average of 113.8 inches of rain each year with 11.4 inches of snow.

  • There is an average of 3:59 hours of sun each day in Allegheny County.

StatAllegheny County
Mean High67.9
Nice Days81.68
Rainfall113.8
Snowfall11.4
Sunny_hours3:59
67.9°
Average High
113.8
Inches of Rain

Allegheny County Photos

North Zion Lutheran Churchc Baldwinc   C
Source: Public Domain
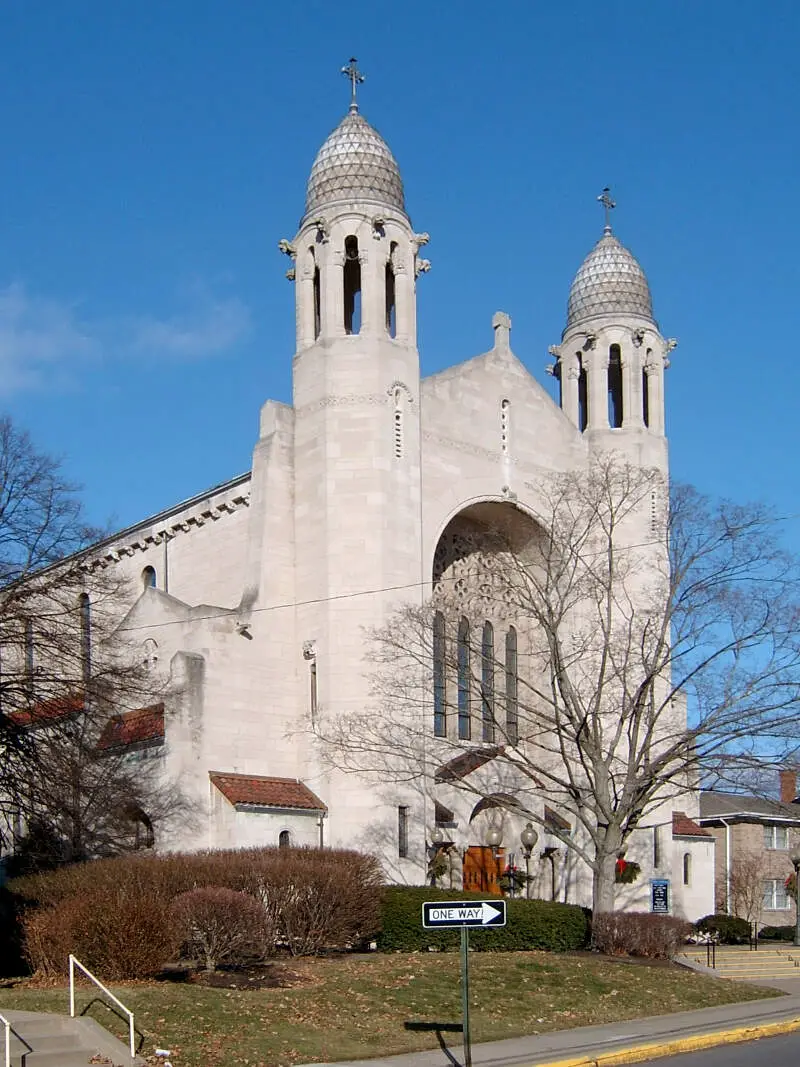
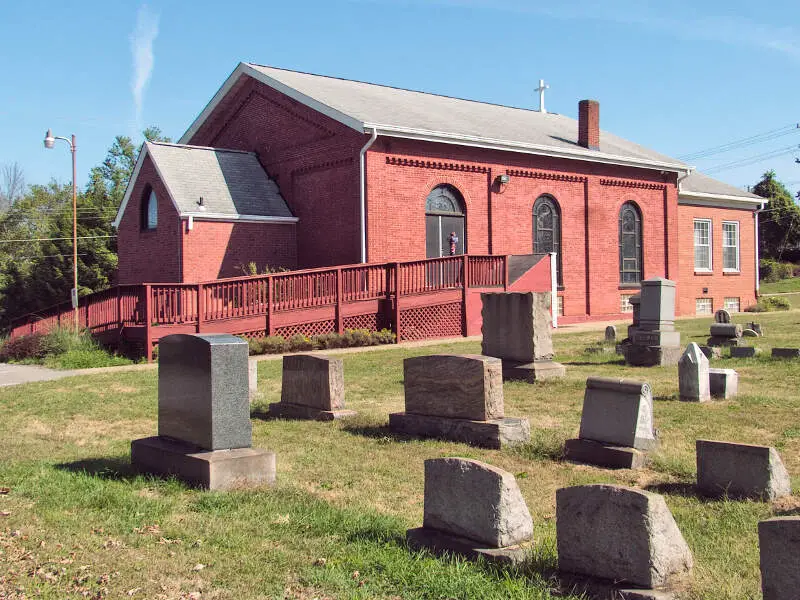
Church Of The Assumptionc Bellevuec   C
Source: Public Domain
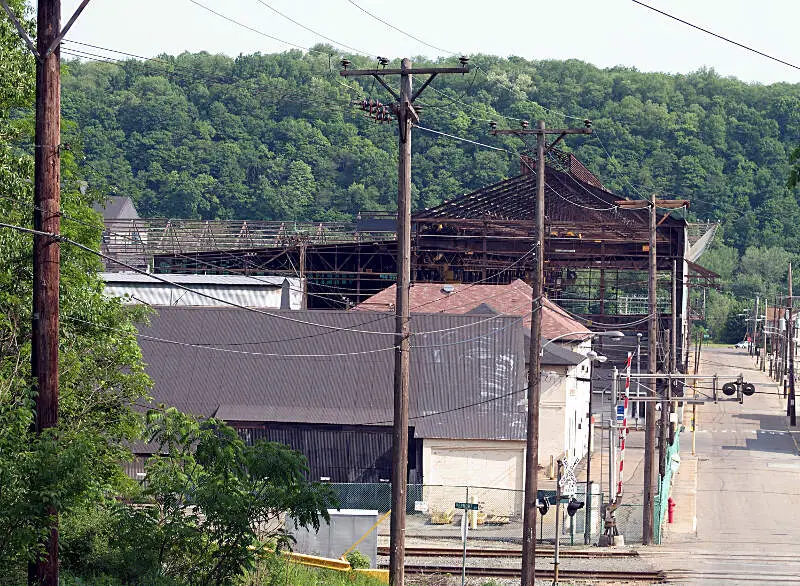
Allegheny Ludlum Brackenridge Works
Source: Wikipedia User takomabibelot | CC BY 2.0
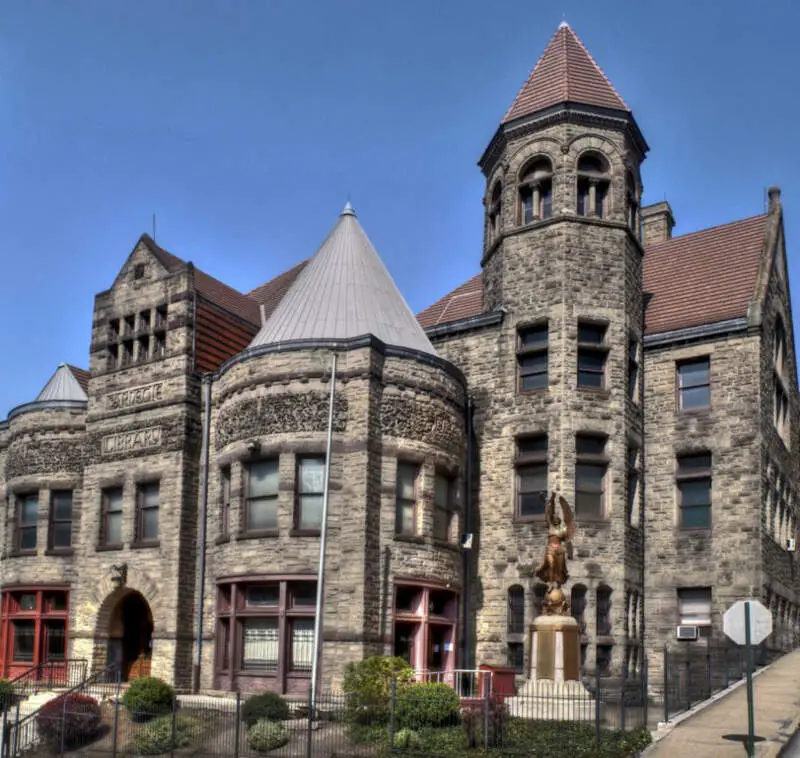
Bcl X
Source: Wikipedia User Christopher Rolinson | CC BY 3.0 us
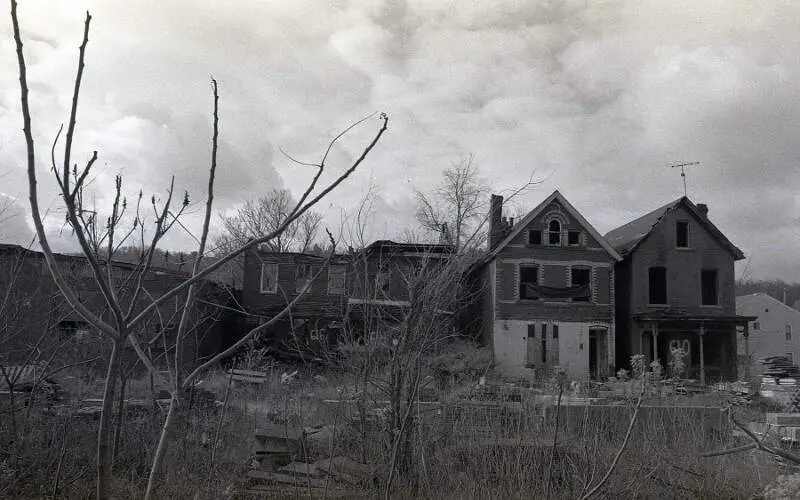
Condemned Houses In Braddockc Pennsylvania
Source: Wikipedia User katie chao and ben muessi | CC BY 2.0
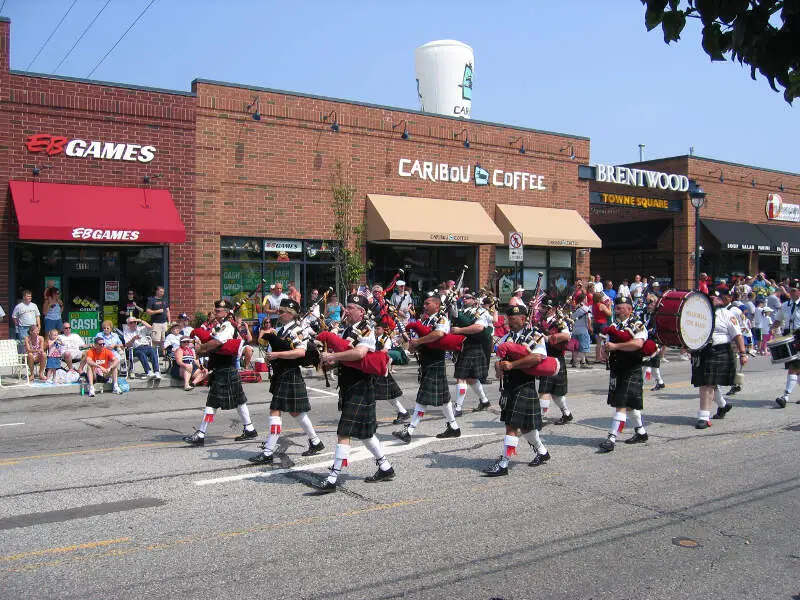
Brentwood Thjuly
Source: Wikipedia User The original uploader was | CC BY-SA 2.5

Allegheny County Demographics

Population over time in Allegheny County

The current population in Allegheny County is 1,245,310. The population has increased 2.0% from 2019.

Year Population % Change
2022 1,246,116 2.3%
2021 1,218,380 -0.3%
2020 1,221,744 -

Gender in Allegheny County

  • Allegheny County is 51.2% female with 637,753 female residents.

  • Allegheny County is 48.8% male with 607,557 male residents.

Female
51.2% (637,753)
Male
48.8% (607,557)
Gender Allegheny County PA USA
Female 51.2% 50.6% 50.4%
Male 48.8% 49.4% 49.6%

Race / Ethnicity in Allegheny County

Allegheny County is:

  • 77.0% White with 958,410 White residents.

  • 12.6% African American with 156,588 African American residents.

  • 0.1% American Indian with 819 American Indian residents.

  • 4.1% Asian with 50,668 Asian residents.

  • 0.0% Hawaiian with 163 Hawaiian residents.

  • 0.4% Other with 5,007 Other residents.

  • 3.6% Two Or More with 44,383 Two Or More residents.

  • 2.4% Hispanic with 29,272 Hispanic residents.

White
77.0% (958,410)
African American
12.6% (156,588)
American Indian
0.1% (819)
Asian
4.1% (50,668)
Hawaiian
0.0% (163)
Other
0.4% (5,007)
Two Or More
3.6% (44,383)
Hispanic
2.4% (29,272)

Table: Allegheny County By Race

Race Allegheny County PA USA
White 77.0% 74.5% 58.9%
African American 12.6% 10.4% 12.1%
American Indian 0.1% 0.1% 0.6%
Asian 4.1% 3.6% 5.7%
Hawaiian 0.0% 0.0% 0.2%
Other 0.4% 0.4% 0.4%
Two Or More 3.6% 3.0% 3.5%
Hispanic 2.4% 8.1% 18.7%

Household Income For Allegheny County, Pennsylvania

  • 5.4% of households in Allegheny County earn Less than $10,000.

  • 4.1% of households in Allegheny County earn $10,000 to $14,999.

  • 7.3% of households in Allegheny County earn $15,000 to $24,999.

  • 7.6% of households in Allegheny County earn $25,000 to $34,999.

  • 11.1% of households in Allegheny County earn $35,000 to $49,999.

  • 16.0% of households in Allegheny County earn $50,000 to $74,999.

  • 12.3% of households in Allegheny County earn $75,000 to $99,999.

  • 16.7% of households in Allegheny County earn $100,000 to $149,999.

  • 8.9% of households in Allegheny County earn $150,000 to $199,999.

  • 10.8% of households in Allegheny County earn $200,000 or more.

Less than $10,000
5.4% (66,700)
$10,000 to $14,999
4.1% (51,495)
$15,000 to $24,999
7.3% (90,326)
$25,000 to $34,999
7.6% (94,307)
$35,000 to $49,999
11.1% (138,031)
$50,000 to $74,999
16.0% (199,153)
$75,000 to $99,999
12.3% (153,081)
$100,000 to $149,999
16.7% (207,516)
$150,000 to $199,999
8.9% (110,737)
$200,000 or more
10.8% (133,959)
Income Allegheny County PA USA
Less than $10,000 5.4% 4.8% 4.9%
$10,000 to $14,999 4.1% 3.9% 3.8%
$15,000 to $24,999 7.3% 7.4% 7.0%
$25,000 to $34,999 7.6% 7.6% 7.4%
$35,000 to $49,999 11.1% 11.0% 10.7%
$50,000 to $74,999 16.0% 16.3% 16.1%
$75,000 to $99,999 12.3% 13.0% 12.8%
$100,000 to $149,999 16.7% 17.2% 17.1%
$150,000 to $199,999 8.9% 8.5% 8.8%
$200,000 or more 10.8% 10.2% 11.4%

Highest level of educational attainment in Allegheny County for adults over 25

  • 1.0% of adults in Allegheny County completed < 9th grade.

  • 3.0% of adults in Allegheny County completed 9-12th grade.

  • 26.0% of adults in Allegheny County completed high school / ged.

  • 16.0% of adults in Allegheny County completed some college.

  • 10.0% of adults in Allegheny County completed associate's degree.

  • 25.0% of adults in Allegheny County completed bachelor's degree.

  • 13.0% of adults in Allegheny County completed master's degree.

  • 3.0% of adults in Allegheny County completed professional degree.

  • 3.0% of adults in Allegheny County completed doctorate degree.

< 9th Grade
1% (12,453)
9-12th Grade
3% (37,359)
High School / GED
26% (323,780)
Some College
16% (199,249)
Associate's Degree
10% (124,531)
Bachelor's Degree
25% (311,327)
Master's Degree
13% (161,890)
Professional Degree
3% (37,359)
Doctorate Degree
3% (37,359)
Education Allegheny County PA USA
< 9th Grade 1% 2% 3%
9-12th Grade 3% 5% 6%
High School / GED 26% 34% 26%
Some College 16% 16% 20%
Associate's Degree 10% 9% 9%
Bachelor's Degree 25% 20% 21%
Master's Degree 13% 10% 10%
Professional Degree 3% 2% 2%
Doctorate Degree 3% 2% 2%

Articles About Pennsylvania

Enjoy The Snack?

About HomeSnacks

HomeSnacks is based in Durham, NC.

We aim to deliver bite-sized pieces of infotainment about where you live.

We use data, analytics, and a sense of humor to determine quality of life for places across the nation.

© Chasing Chains, LLC. All rights reserved.