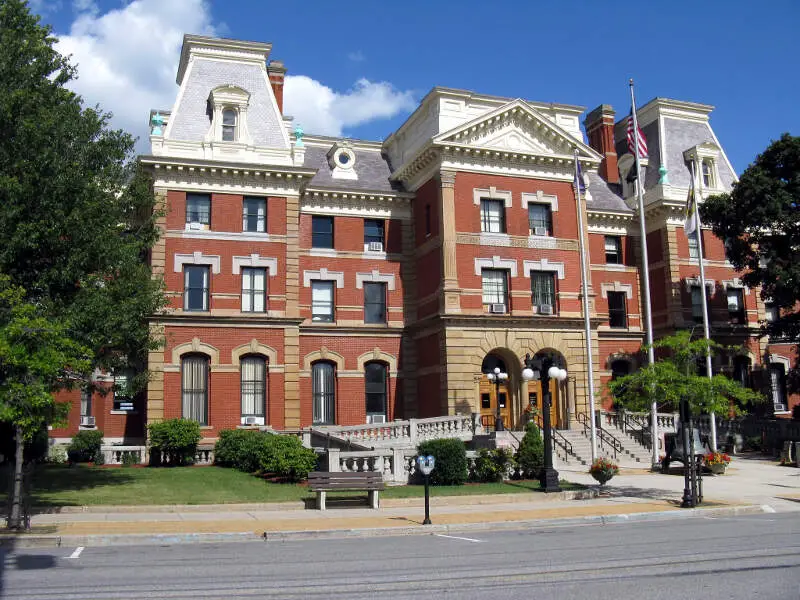

Life in Cambria County research summary. HomeSnacks has been researching the quality of life in Cambria County over the past eight years using Census data, FBI crime data, cost of living data, and other primary sources. Based on the most recently available data, we found the following about life in Cambria County:
The population in Cambria County is 133,263.
The median home value in Cambria County is $104,935.
The median income in Cambria County is $54,221.
The median rent in Cambria County is $700.
The unemployment rate in Cambria County is 5.0%.
The poverty rate in Cambria County is 14.4%.
The average high in Cambria County is 64.2° and there are 104.7 inches of rainfall annually.
The average high in Cambria County is 64.2°.
There are 78.27 nice days each year.
Expect an average of 104.7 inches of rain each year with 18.0 inches of snow.
There is an average of 3:51 hours of sun each day in Cambria County.
| Stat | Cambria County |
|---|---|
| Mean High | 64.2 |
| Nice Days | 78.27 |
| Rainfall | 104.7 |
| Snowfall | 18.0 |
| Sunny_hours | 3:51 |

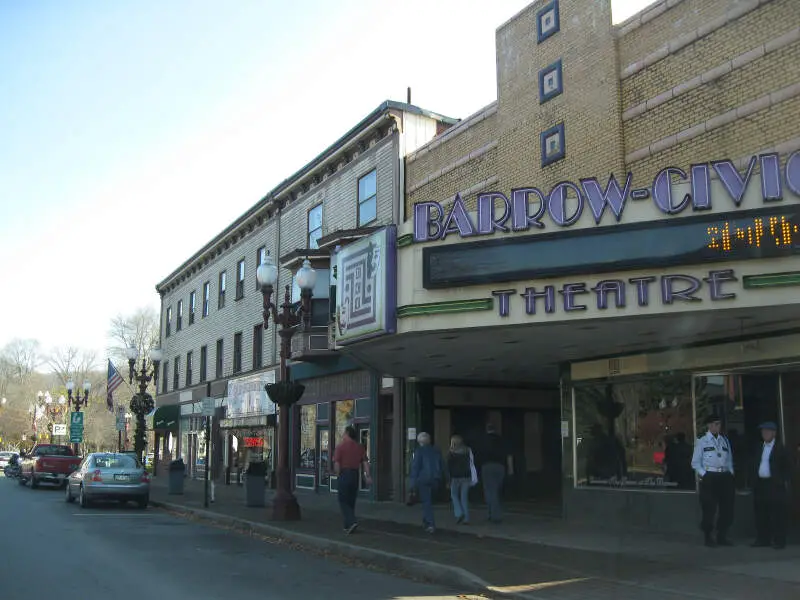
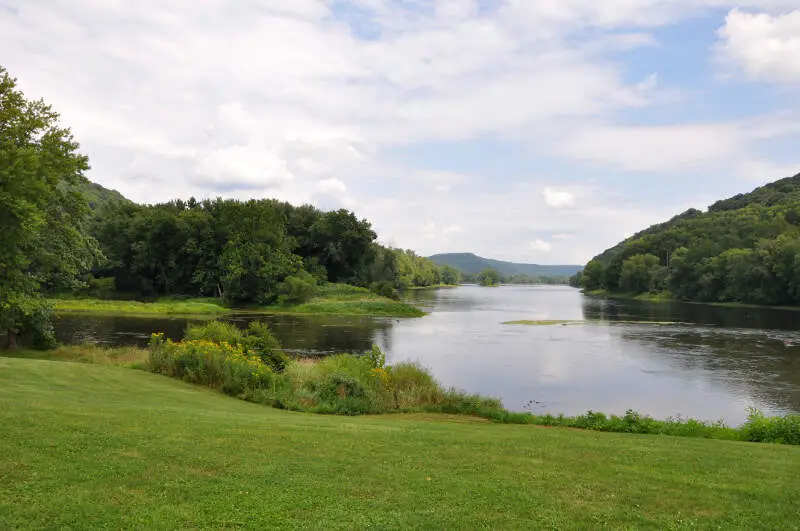


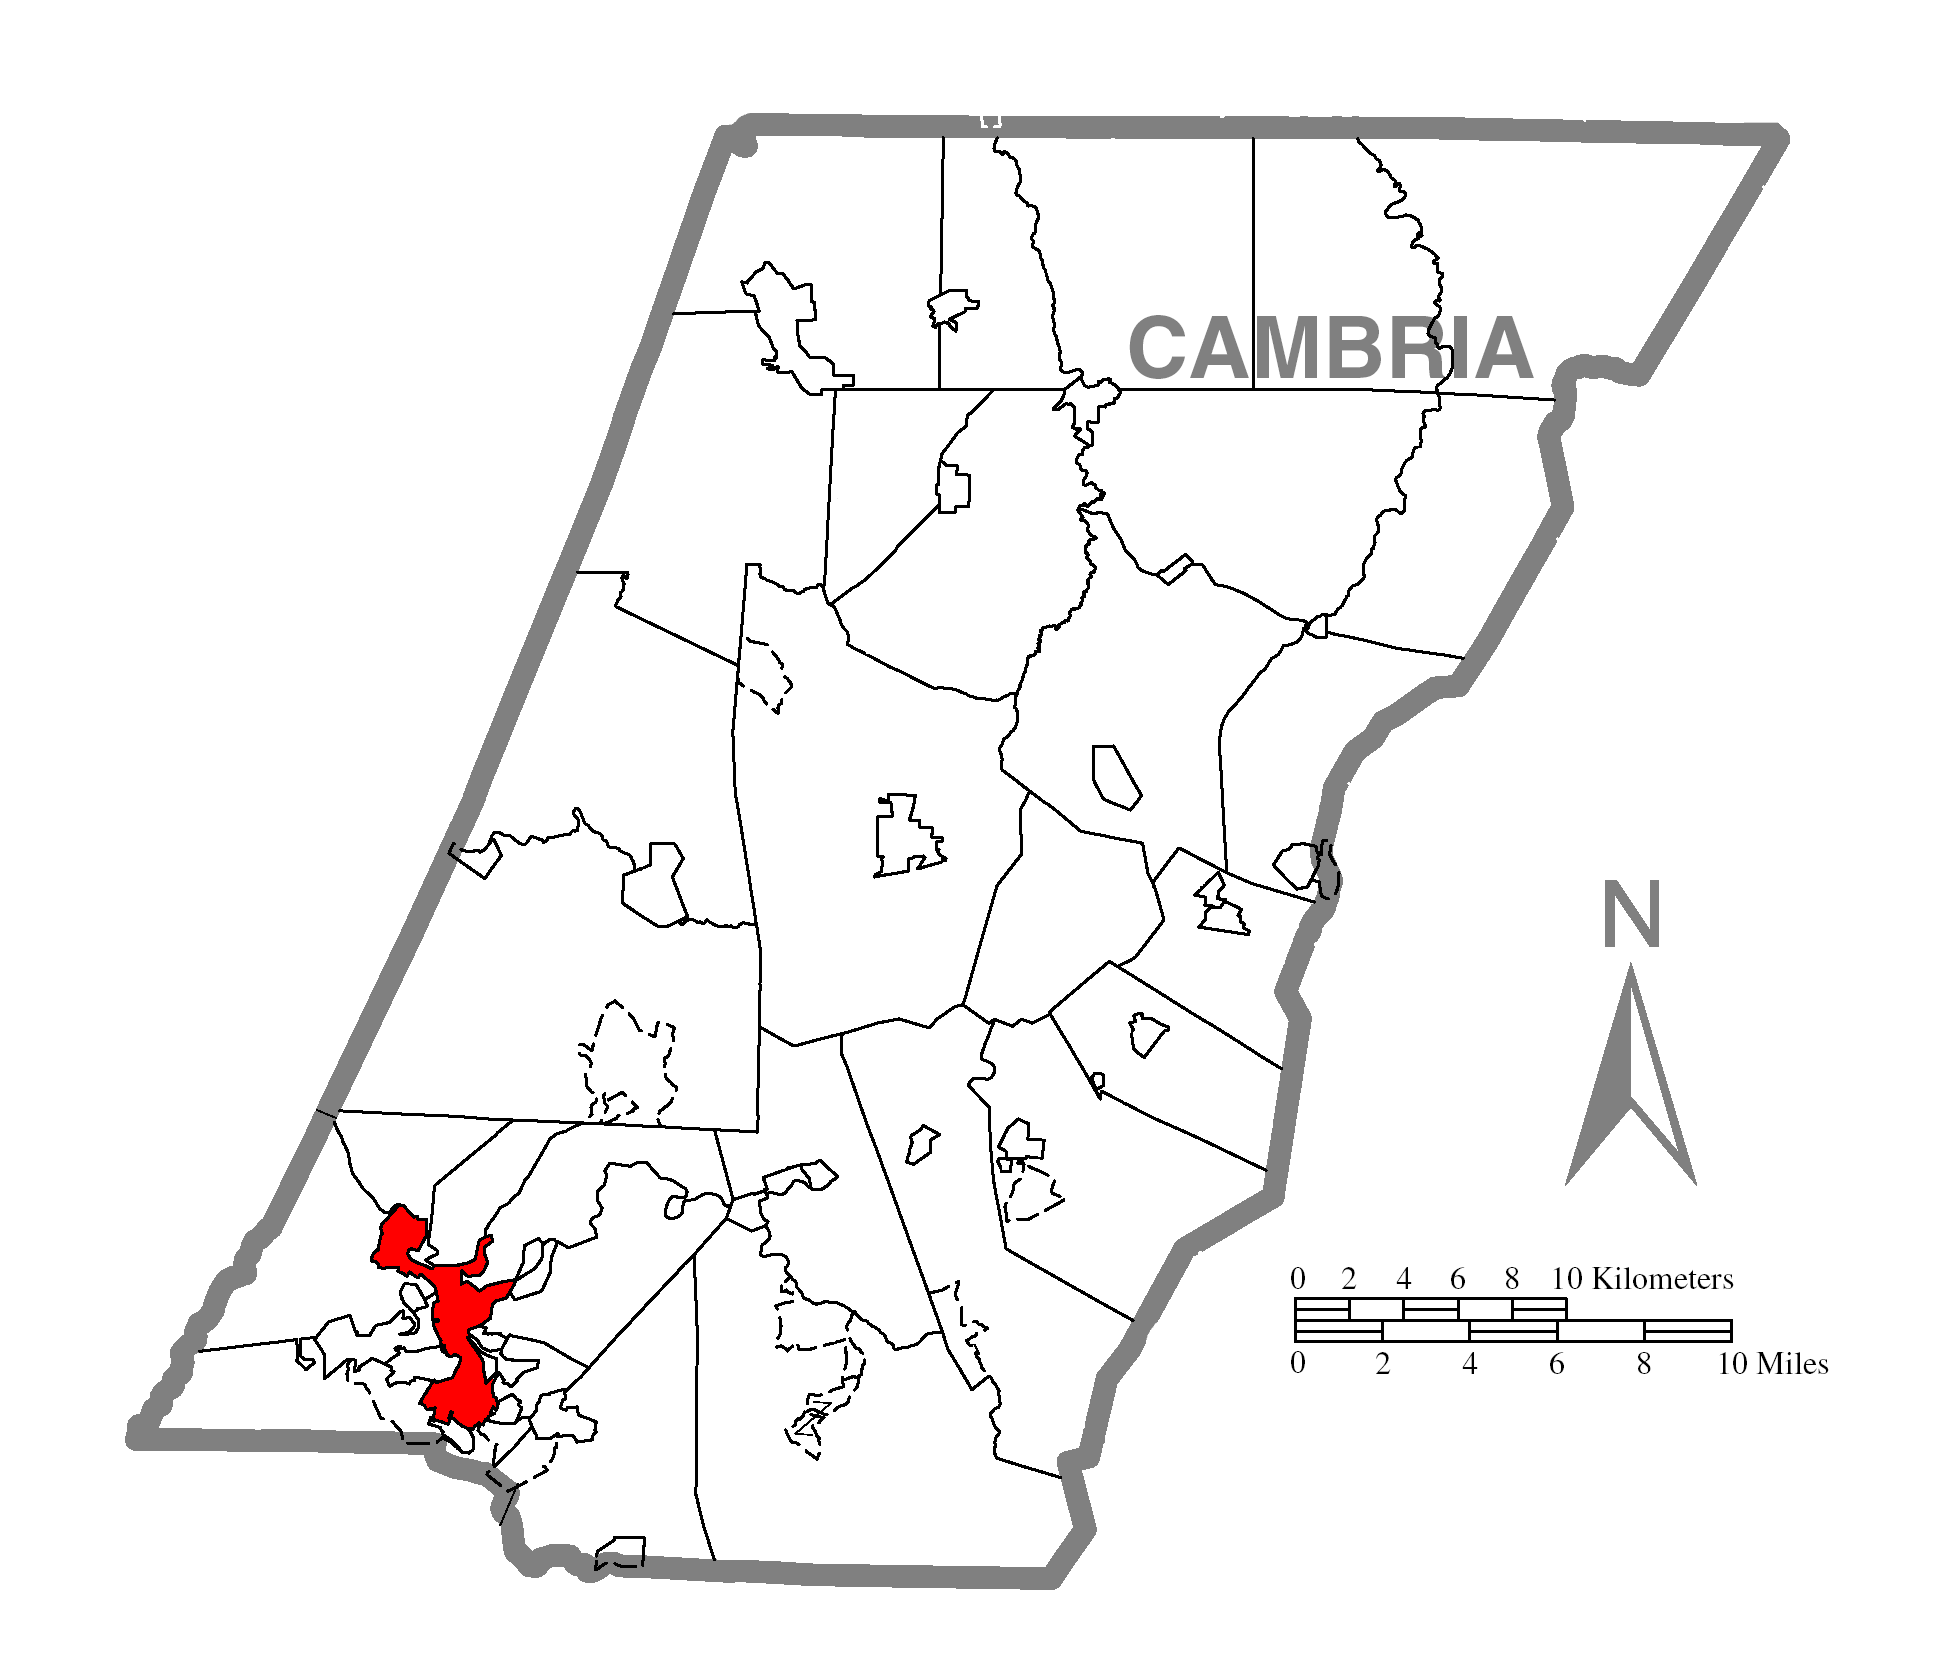
The current population in Cambria County is 133,263. The population has increased 0.8% from 2019.
| Year | Population | % Change |
|---|---|---|
| 2022 | 134,048 | 1.9% |
| 2021 | 131,611 | -1.1% |
| 2020 | 133,009 | - |
Cambria County is 50.2% female with 66,852 female residents.
Cambria County is 49.8% male with 66,411 male residents.
| Gender | Cambria County | PA | USA |
|---|---|---|---|
| Female | 50.2% | 50.6% | 50.4% |
| Male | 49.8% | 49.4% | 49.6% |
Cambria County is:
91.4% White with 121,836 White residents.
3.4% African American with 4,540 African American residents.
0.0% American Indian with 26 American Indian residents.
0.5% Asian with 660 Asian residents.
0.0% Hawaiian with 21 Hawaiian residents.
0.2% Other with 283 Other residents.
2.6% Two Or More with 3,433 Two Or More residents.
1.8% Hispanic with 2,464 Hispanic residents.
| Race | Cambria County | PA | USA |
|---|---|---|---|
| White | 91.4% | 74.5% | 58.9% |
| African American | 3.4% | 10.4% | 12.1% |
| American Indian | 0.0% | 0.1% | 0.6% |
| Asian | 0.5% | 3.6% | 5.7% |
| Hawaiian | 0.0% | 0.0% | 0.2% |
| Other | 0.2% | 0.4% | 0.4% |
| Two Or More | 2.6% | 3.0% | 3.5% |
| Hispanic | 1.8% | 8.1% | 18.7% |
5.8% of households in Cambria County earn Less than $10,000.
5.7% of households in Cambria County earn $10,000 to $14,999.
10.0% of households in Cambria County earn $15,000 to $24,999.
10.7% of households in Cambria County earn $25,000 to $34,999.
14.1% of households in Cambria County earn $35,000 to $49,999.
17.5% of households in Cambria County earn $50,000 to $74,999.
12.9% of households in Cambria County earn $75,000 to $99,999.
14.9% of households in Cambria County earn $100,000 to $149,999.
4.8% of households in Cambria County earn $150,000 to $199,999.
3.6% of households in Cambria County earn $200,000 or more.
| Income | Cambria County | PA | USA |
|---|---|---|---|
| Less than $10,000 | 5.8% | 4.8% | 4.9% |
| $10,000 to $14,999 | 5.7% | 3.9% | 3.8% |
| $15,000 to $24,999 | 10.0% | 7.4% | 7.0% |
| $25,000 to $34,999 | 10.7% | 7.6% | 7.4% |
| $35,000 to $49,999 | 14.1% | 11.0% | 10.7% |
| $50,000 to $74,999 | 17.5% | 16.3% | 16.1% |
| $75,000 to $99,999 | 12.9% | 13.0% | 12.8% |
| $100,000 to $149,999 | 14.9% | 17.2% | 17.1% |
| $150,000 to $199,999 | 4.8% | 8.5% | 8.8% |
| $200,000 or more | 3.6% | 10.2% | 11.4% |
3.0% of adults in Cambria County completed < 9th grade.
5.0% of adults in Cambria County completed 9-12th grade.
44.0% of adults in Cambria County completed high school / ged.
15.0% of adults in Cambria County completed some college.
11.0% of adults in Cambria County completed associate's degree.
15.0% of adults in Cambria County completed bachelor's degree.
5.0% of adults in Cambria County completed master's degree.
1.0% of adults in Cambria County completed professional degree.
1.0% of adults in Cambria County completed doctorate degree.
| Education | Cambria County | PA | USA |
|---|---|---|---|
| < 9th Grade | 3% | 2% | 3% |
| 9-12th Grade | 5% | 5% | 6% |
| High School / GED | 44% | 34% | 26% |
| Some College | 15% | 16% | 20% |
| Associate's Degree | 11% | 9% | 9% |
| Bachelor's Degree | 15% | 20% | 21% |
| Master's Degree | 5% | 10% | 10% |
| Professional Degree | 1% | 2% | 2% |
| Doctorate Degree | 1% | 2% | 2% |
HomeSnacks is based in Durham, NC.
We aim to deliver bite-sized pieces of infotainment about where you live.
We use data, analytics, and a sense of humor to determine quality of life for places across the nation.