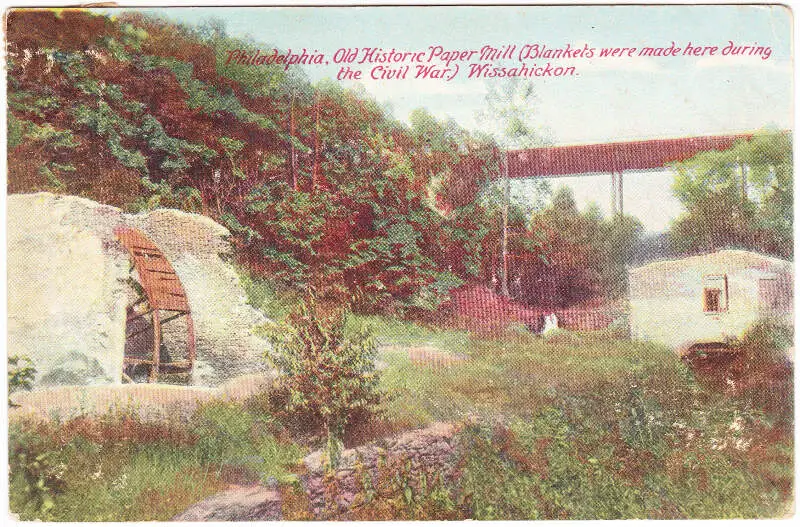

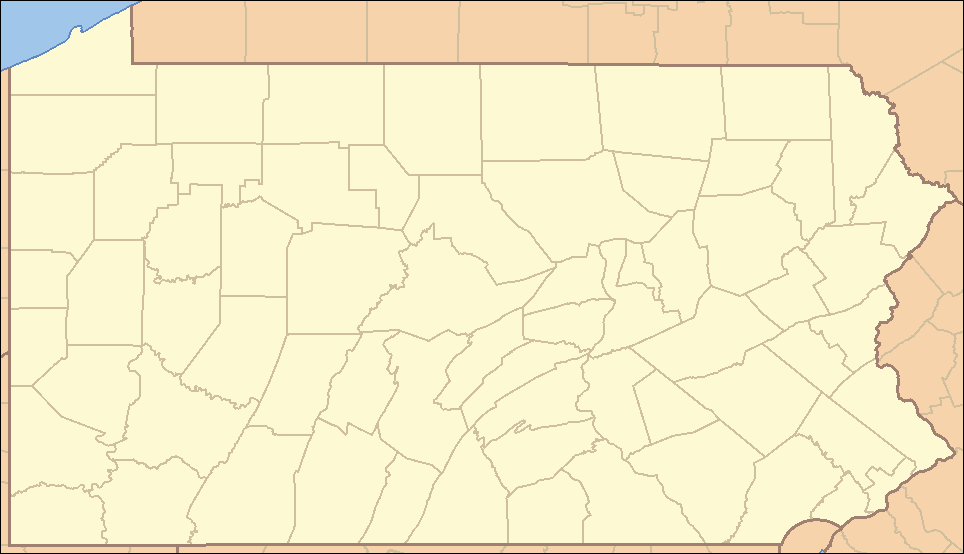
Life in Montgomery County research summary. HomeSnacks has been researching the quality of life in Montgomery County over the past eight years using Census data, FBI crime data, cost of living data, and other primary sources. Based on the most recently available data, we found the following about life in Montgomery County:
The population in Montgomery County is 856,399.
The median home value in Montgomery County is $439,249.
The median income in Montgomery County is $107,441.
The median rent in Montgomery County is $1,514.
The unemployment rate in Montgomery County is 4.5%.
The poverty rate in Montgomery County is 6.3%.
The average high in Montgomery County is 69.3° and there are 105.9 inches of rainfall annually.
The average high in Montgomery County is 69.3°.
There are 83.13 nice days each year.
Expect an average of 105.9 inches of rain each year with 9.3 inches of snow.
There is an average of 4:46 hours of sun each day in Montgomery County.
| Stat | Montgomery County |
|---|---|
| Mean High | 69.3 |
| Nice Days | 83.13 |
| Rainfall | 105.9 |
| Snowfall | 9.3 |
| Sunny_hours | 4:46 |

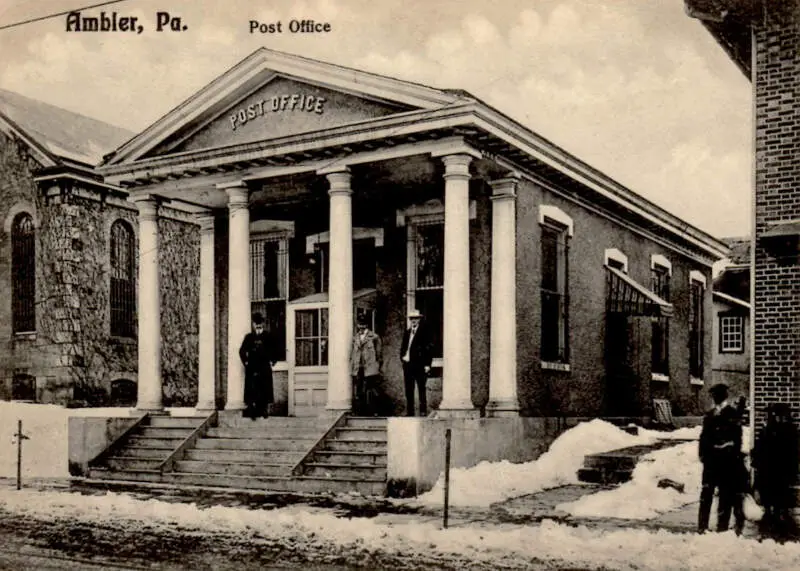
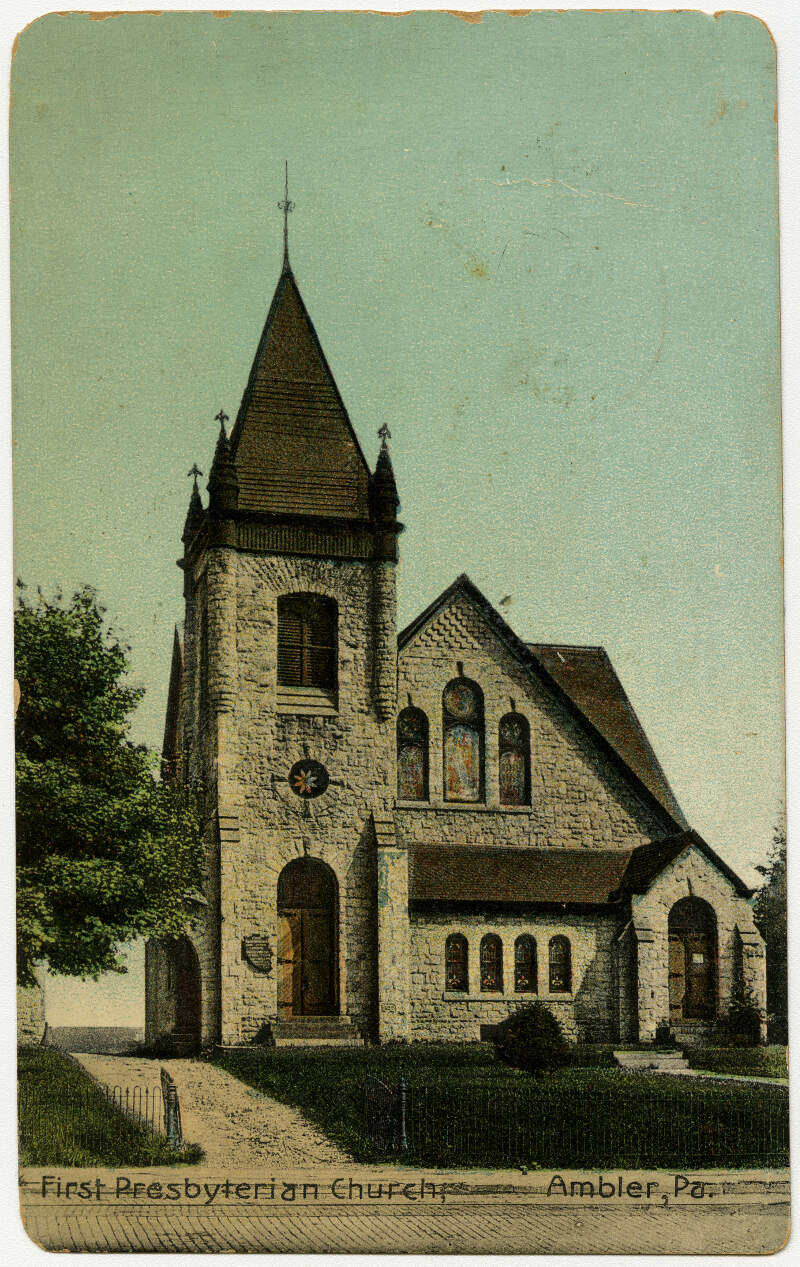

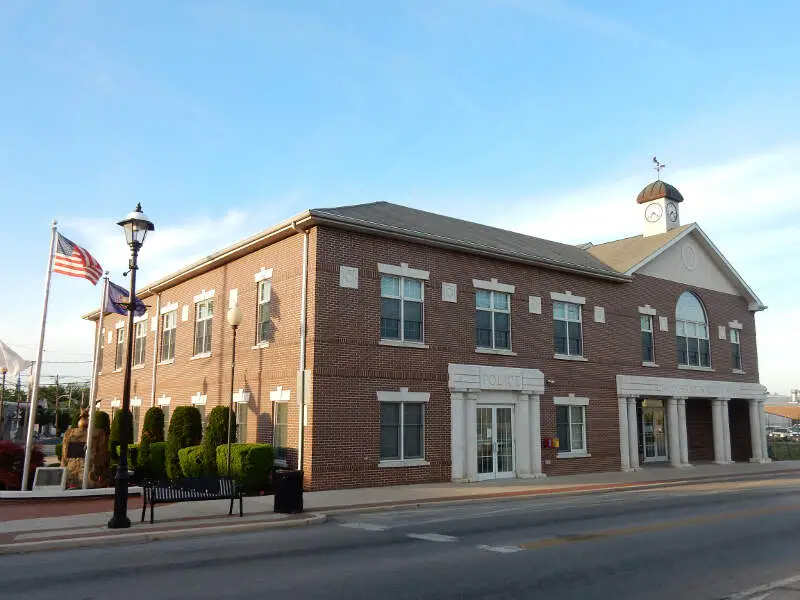
The current population in Montgomery County is 856,399. The population has increased 3.3% from 2019.
| Year | Population | % Change |
|---|---|---|
| 2022 | 850,890 | 2.9% |
| 2021 | 827,180 | 0.4% |
| 2020 | 823,823 | - |
Montgomery County is 51.0% female with 436,465 female residents.
Montgomery County is 49.0% male with 419,933 male residents.
| Gender | Montgomery County | PA | USA |
|---|---|---|---|
| Female | 51.0% | 50.6% | 50.4% |
| Male | 49.0% | 49.4% | 49.6% |
Montgomery County is:
73.6% White with 629,925 White residents.
9.0% African American with 76,697 African American residents.
0.0% American Indian with 185 American Indian residents.
7.8% Asian with 67,062 Asian residents.
0.0% Hawaiian with 169 Hawaiian residents.
0.5% Other with 4,102 Other residents.
3.5% Two Or More with 29,735 Two Or More residents.
5.7% Hispanic with 48,524 Hispanic residents.
| Race | Montgomery County | PA | USA |
|---|---|---|---|
| White | 73.6% | 74.5% | 58.9% |
| African American | 9.0% | 10.4% | 12.1% |
| American Indian | 0.0% | 0.1% | 0.6% |
| Asian | 7.8% | 3.6% | 5.7% |
| Hawaiian | 0.0% | 0.0% | 0.2% |
| Other | 0.5% | 0.4% | 0.4% |
| Two Or More | 3.5% | 3.0% | 3.5% |
| Hispanic | 5.7% | 8.1% | 18.7% |
3.1% of households in Montgomery County earn Less than $10,000.
1.9% of households in Montgomery County earn $10,000 to $14,999.
4.4% of households in Montgomery County earn $15,000 to $24,999.
4.7% of households in Montgomery County earn $25,000 to $34,999.
7.7% of households in Montgomery County earn $35,000 to $49,999.
12.9% of households in Montgomery County earn $50,000 to $74,999.
11.9% of households in Montgomery County earn $75,000 to $99,999.
19.2% of households in Montgomery County earn $100,000 to $149,999.
12.3% of households in Montgomery County earn $150,000 to $199,999.
21.8% of households in Montgomery County earn $200,000 or more.
| Income | Montgomery County | PA | USA |
|---|---|---|---|
| Less than $10,000 | 3.1% | 4.8% | 4.9% |
| $10,000 to $14,999 | 1.9% | 3.9% | 3.8% |
| $15,000 to $24,999 | 4.4% | 7.4% | 7.0% |
| $25,000 to $34,999 | 4.7% | 7.6% | 7.4% |
| $35,000 to $49,999 | 7.7% | 11.0% | 10.7% |
| $50,000 to $74,999 | 12.9% | 16.3% | 16.1% |
| $75,000 to $99,999 | 11.9% | 13.0% | 12.8% |
| $100,000 to $149,999 | 19.2% | 17.2% | 17.1% |
| $150,000 to $199,999 | 12.3% | 8.5% | 8.8% |
| $200,000 or more | 21.8% | 10.2% | 11.4% |
2.0% of adults in Montgomery County completed < 9th grade.
3.0% of adults in Montgomery County completed 9-12th grade.
23.0% of adults in Montgomery County completed high school / ged.
14.0% of adults in Montgomery County completed some college.
7.0% of adults in Montgomery County completed associate's degree.
29.0% of adults in Montgomery County completed bachelor's degree.
15.0% of adults in Montgomery County completed master's degree.
4.0% of adults in Montgomery County completed professional degree.
3.0% of adults in Montgomery County completed doctorate degree.
| Education | Montgomery County | PA | USA |
|---|---|---|---|
| < 9th Grade | 2% | 2% | 3% |
| 9-12th Grade | 3% | 5% | 6% |
| High School / GED | 23% | 34% | 26% |
| Some College | 14% | 16% | 20% |
| Associate's Degree | 7% | 9% | 9% |
| Bachelor's Degree | 28% | 20% | 21% |
| Master's Degree | 15% | 10% | 10% |
| Professional Degree | 4% | 2% | 2% |
| Doctorate Degree | 3% | 2% | 2% |
HomeSnacks is based in Durham, NC.
We aim to deliver bite-sized pieces of infotainment about where you live.
We use data, analytics, and a sense of humor to determine quality of life for places across the nation.