

Life in Westmoreland County research summary. HomeSnacks has been researching the quality of life in Westmoreland County over the past eight years using Census data, FBI crime data, cost of living data, and other primary sources. Based on the most recently available data, we found the following about life in Westmoreland County:
The population in Westmoreland County is 354,414.
The median home value in Westmoreland County is $187,630.
The median income in Westmoreland County is $69,454.
The median rent in Westmoreland County is $822.
The unemployment rate in Westmoreland County is 5.0%.
The poverty rate in Westmoreland County is 9.7%.
The average high in Westmoreland County is 67.2° and there are 114.1 inches of rainfall annually.
The average high in Westmoreland County is 67.2°.
There are 81.75 nice days each year.
Expect an average of 114.1 inches of rain each year with 13.1 inches of snow.
There is an average of 3:57 hours of sun each day in Westmoreland County.
| Stat | Westmoreland County |
|---|---|
| Mean High | 67.2 |
| Nice Days | 81.75 |
| Rainfall | 114.1 |
| Snowfall | 13.1 |
| Sunny_hours | 3:57 |

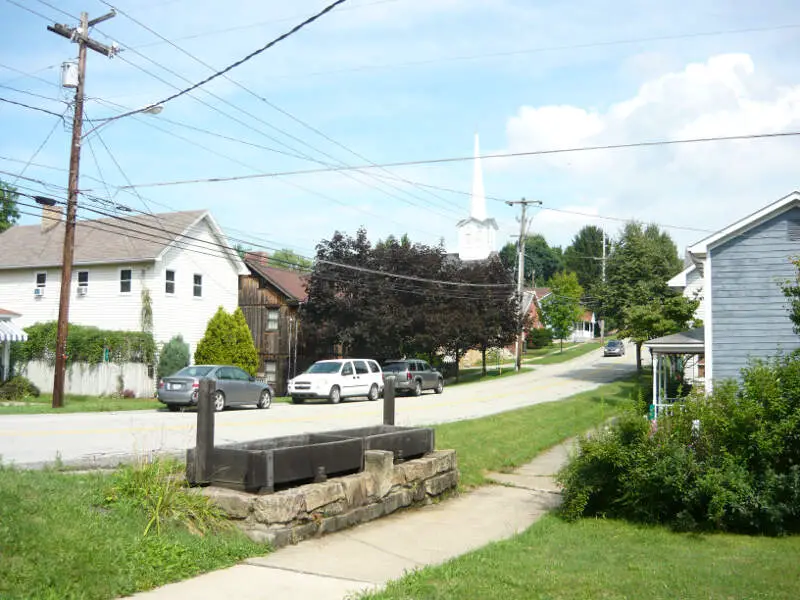
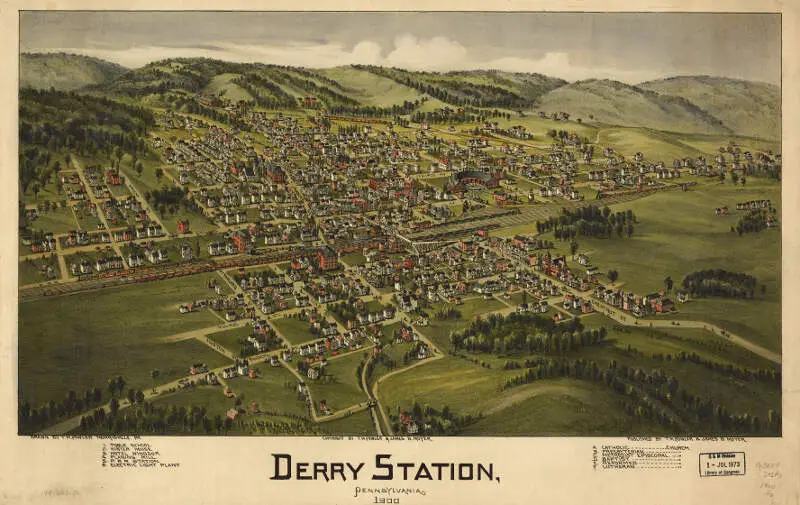
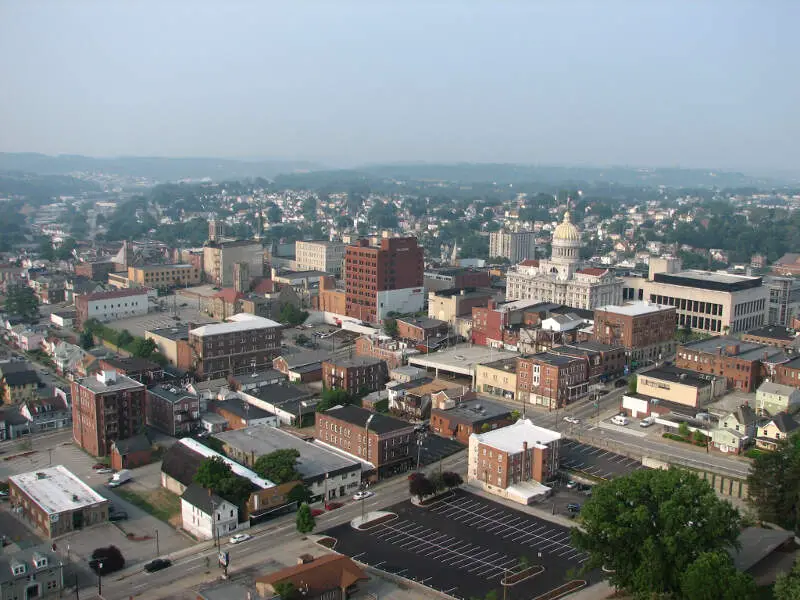
The current population in Westmoreland County is 354,414. The population has increased 0.7% from 2019.
| Year | Population | % Change |
|---|---|---|
| 2022 | 355,107 | 1.3% |
| 2021 | 350,722 | -0.5% |
| 2020 | 352,590 | - |
Westmoreland County is 50.6% female with 179,332 female residents.
Westmoreland County is 49.4% male with 175,081 male residents.
| Gender | Westmoreland County | PA | USA |
|---|---|---|---|
| Female | 50.6% | 50.6% | 50.4% |
| Male | 49.4% | 49.4% | 49.6% |
Westmoreland County is:
92.4% White with 327,570 White residents.
2.4% African American with 8,583 African American residents.
0.0% American Indian with 89 American Indian residents.
0.9% Asian with 3,320 Asian residents.
0.0% Hawaiian with 46 Hawaiian residents.
0.2% Other with 852 Other residents.
2.6% Two Or More with 9,127 Two Or More residents.
1.4% Hispanic with 4,827 Hispanic residents.
| Race | Westmoreland County | PA | USA |
|---|---|---|---|
| White | 92.4% | 74.5% | 58.9% |
| African American | 2.4% | 10.4% | 12.1% |
| American Indian | 0.0% | 0.1% | 0.6% |
| Asian | 0.9% | 3.6% | 5.7% |
| Hawaiian | 0.0% | 0.0% | 0.2% |
| Other | 0.2% | 0.4% | 0.4% |
| Two Or More | 2.6% | 3.0% | 3.5% |
| Hispanic | 1.4% | 8.1% | 18.7% |
4.3% of households in Westmoreland County earn Less than $10,000.
4.0% of households in Westmoreland County earn $10,000 to $14,999.
8.4% of households in Westmoreland County earn $15,000 to $24,999.
8.2% of households in Westmoreland County earn $25,000 to $34,999.
11.8% of households in Westmoreland County earn $35,000 to $49,999.
16.5% of households in Westmoreland County earn $50,000 to $74,999.
13.9% of households in Westmoreland County earn $75,000 to $99,999.
17.3% of households in Westmoreland County earn $100,000 to $149,999.
7.8% of households in Westmoreland County earn $150,000 to $199,999.
7.7% of households in Westmoreland County earn $200,000 or more.
| Income | Westmoreland County | PA | USA |
|---|---|---|---|
| Less than $10,000 | 4.3% | 4.8% | 4.9% |
| $10,000 to $14,999 | 4.0% | 3.9% | 3.8% |
| $15,000 to $24,999 | 8.4% | 7.4% | 7.0% |
| $25,000 to $34,999 | 8.2% | 7.6% | 7.4% |
| $35,000 to $49,999 | 11.8% | 11.0% | 10.7% |
| $50,000 to $74,999 | 16.5% | 16.3% | 16.1% |
| $75,000 to $99,999 | 13.9% | 13.0% | 12.8% |
| $100,000 to $149,999 | 17.3% | 17.2% | 17.1% |
| $150,000 to $199,999 | 7.8% | 8.5% | 8.8% |
| $200,000 or more | 7.7% | 10.2% | 11.4% |
0.0% of adults in Westmoreland County completed < 9th grade.
3.0% of adults in Westmoreland County completed 9-12th grade.
36.0% of adults in Westmoreland County completed high school / ged.
17.0% of adults in Westmoreland County completed some college.
12.0% of adults in Westmoreland County completed associate's degree.
20.0% of adults in Westmoreland County completed bachelor's degree.
9.0% of adults in Westmoreland County completed master's degree.
2.0% of adults in Westmoreland County completed professional degree.
1.0% of adults in Westmoreland County completed doctorate degree.
| Education | Westmoreland County | PA | USA |
|---|---|---|---|
| < 9th Grade | 0% | 2% | 3% |
| 9-12th Grade | 3% | 5% | 6% |
| High School / GED | 36% | 34% | 26% |
| Some College | 17% | 16% | 20% |
| Associate's Degree | 12% | 9% | 9% |
| Bachelor's Degree | 20% | 20% | 21% |
| Master's Degree | 9% | 10% | 10% |
| Professional Degree | 2% | 2% | 2% |
| Doctorate Degree | 1% | 2% | 2% |
HomeSnacks is based in Durham, NC.
We aim to deliver bite-sized pieces of infotainment about where you live.
We use data, analytics, and a sense of humor to determine quality of life for places across the nation.