Sure, a Saturday morning right after a foot of fluffy snow is the best thing ever. But that same amount of snow on Tuesday in South Carolina can make a commute last forever. Imagine it’s the dead of winter and the time of year when the ground is frozen, the air is bone-chilling, and there are piles of dirty, nasty, ice-encrusted snow all over the place.
And while South Carolina doesn’t get that much snow, some places get a bit of snow. This is about the time of year when you’re just about ready for spring — especially in Greer, the snowiest place in South Carolina.
So, put on your parkas, snow boots, and gloves, and let’s go outside to see which South Carolina cities get dumped on the most every year. After analyzing all the cities in South Carolina with Saturday Night Science, we came up with this list as the 10 snowiest cities in Palmetto State.
Table Of Contents: Top Ten | Methodology | Table
The 10 Snowiest Cities In South Carolina For 2024
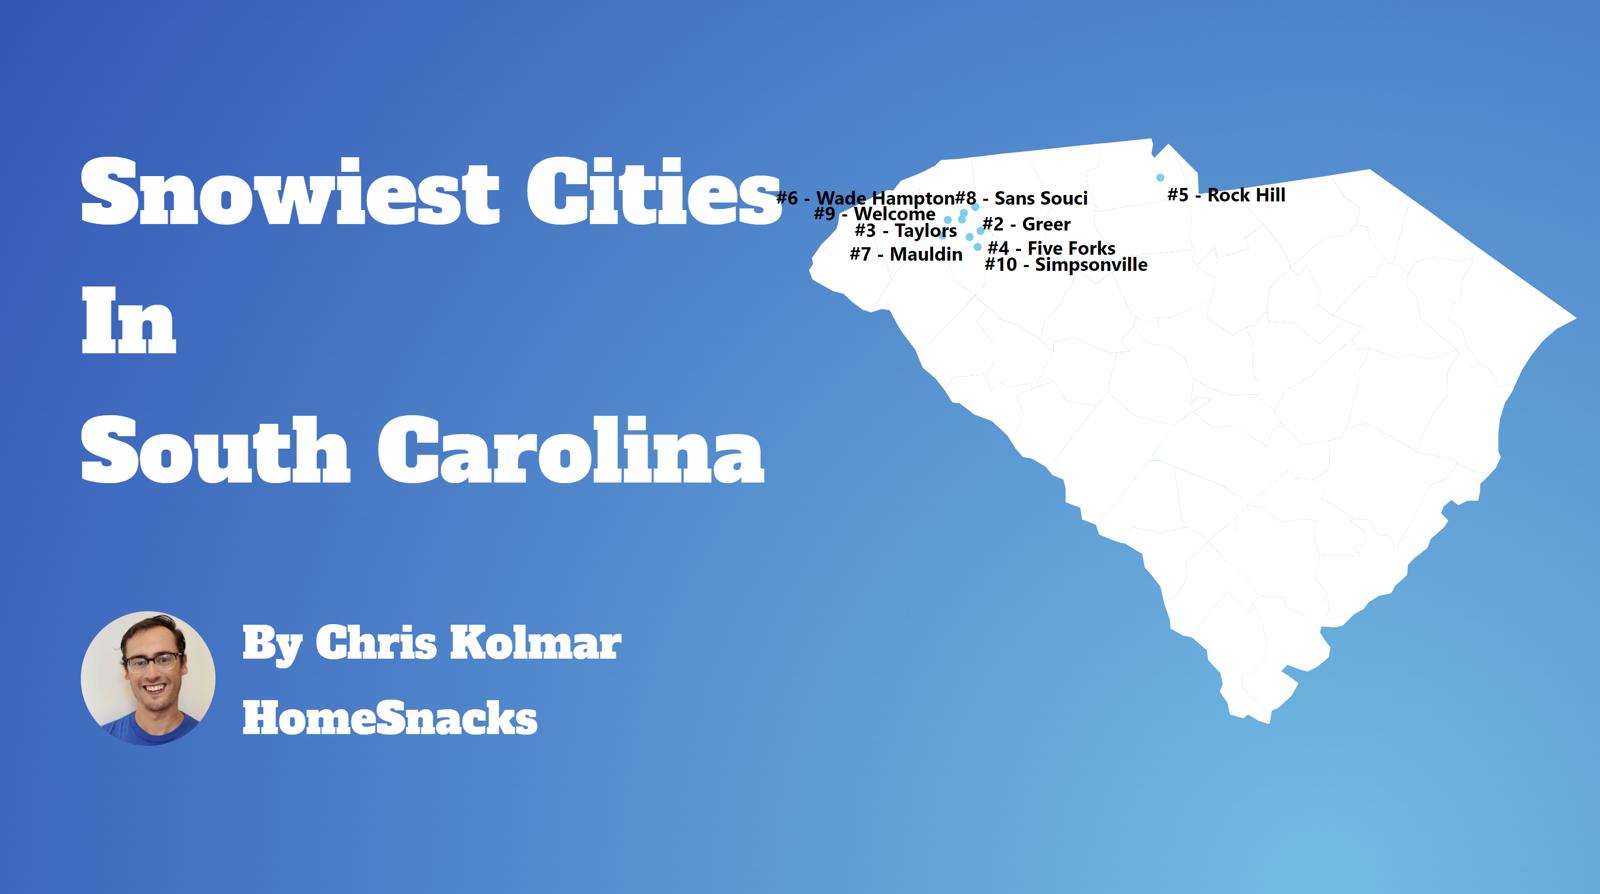
What’s the snowiest place in South Carolina with more than 5,000 people? That would be Greer with an average annual snowfall of 4.2 inches.
Read on below to see where your town ranked, you snow angels.
And if you already knew these places were snowy, check out the best places to live in South Carolina or the cheapest places in South Carolina.
The 10 Snowiest Cities In South Carolina For 2024
/10
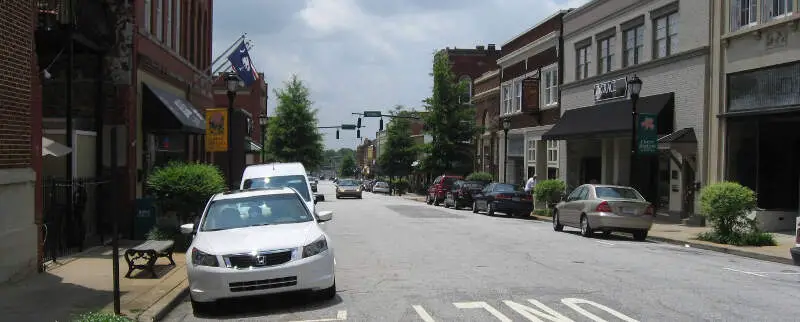
Population: 27,186
Average Annual Snowfall: 4.2 inches
More on Greer: Data | Crime | Cost Of Living | Real Estate
/10
Population: 22,475
Average Annual Snowfall: 3.6 inches
More on Taylors: Data | Cost Of Living | Real Estate
/10
Population: 16,398
Average Annual Snowfall: 3.5 inches
More on Five Forks: Data | Cost Of Living | Real Estate
/10
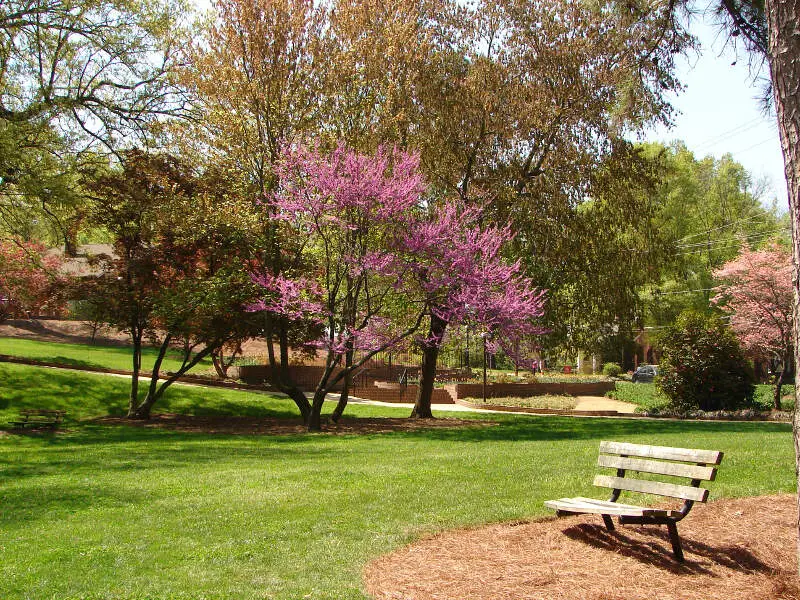
Population: 69,196
Average Annual Snowfall: 3.3 inches
More on Rock Hill: Data | Crime | Cost Of Living | Real Estate
/10
Population: 20,205
Average Annual Snowfall: 3.3 inches
More on Wade Hampton: Data | Cost Of Living | Real Estate
/10
Population: 24,396
Average Annual Snowfall: 3.1 inches
More on Mauldin: Data | Crime | Cost Of Living | Real Estate
/10
Population: 8,288
Average Annual Snowfall: 3.0 inches
More on Sans Souci: Data | Cost Of Living | Real Estate
/10
Population: 6,390
Average Annual Snowfall: 3.0 inches
More on Welcome: Data | Cost Of Living | Real Estate
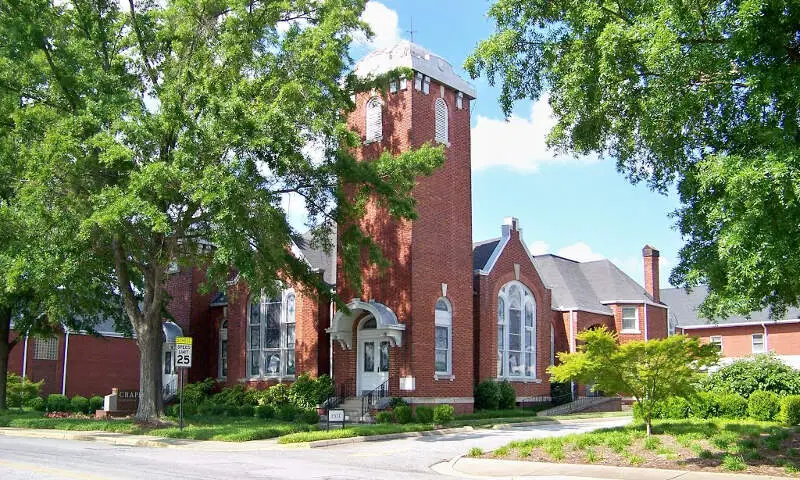
/10
Population: 19,706
Average Annual Snowfall: 2.9 inches
More on Simpsonville: Data | Crime | Cost Of Living | Real Estate
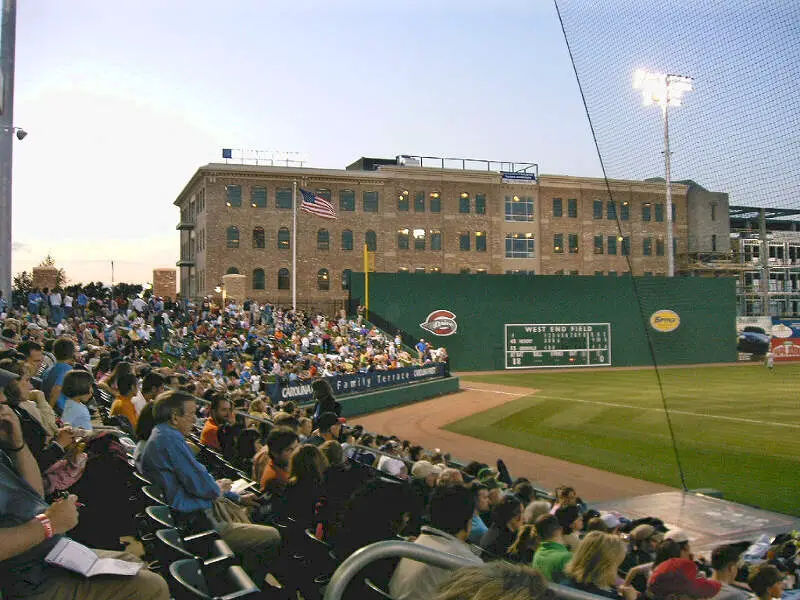
/10
Population: 61,734
Average Annual Snowfall: 2.7 inches
More on Greenville: Data | Crime | Cost Of Living | Real Estate
How We Determined The Cities In South Carolina With The Most Snow
In order to rank the snowiest cities in South Carolina, we used Saturday Night Science and the National Oceanic and Atmospheric Administration (NOAA) database, to see which cities in the Palmetto State get the most annual snowfall.
We updated this article for 2024. This is our second time ranking the snowiest cities in South Carolina.
Before we get too far, here are the annual snowfall rates for major cities:
- Columbia — 0.6 inches
- Charleston — 0.3 inches
- North Charleston — 0.5 inches
The snowiest cities in South Carolina are Greer, Taylors, Five Forks, Rock Hill, Wade Hampton, Mauldin, Sans Souci, Welcome, Simpsonville, and Greenville.
There’s a complete chart at the bottom.
If you’re curious, here are the places that get the least amount of snow in South Carolina with at least snow snowfall:
- Walterboro — 0.2 inches
- Mount Pleasant — 0.2 inches
- Hilton Head Island — 0.2 inches
For more South Carolina reading, check out:
- Best Places To Raise A Family In South Carolina
- Best Places To Retire In South Carolina
- Safest Places In South Carolina
Detailed List Of The Snowiest Places In South Carolina
| Rank | City | Snow (Inches) | Population |
|---|---|---|---|
| 1 | Greer | 4.2 | 27,186 |
| 2 | Taylors | 3.6 | 22,475 |
| 3 | Five Forks | 3.5 | 16,398 |
| 4 | Rock Hill | 3.3 | 69,196 |
| 5 | Wade Hampton | 3.3 | 20,205 |
| 6 | Mauldin | 3.1 | 24,396 |
| 7 | Sans Souci | 3.0 | 8,288 |
| 8 | Welcome | 3.0 | 6,390 |
| 9 | Simpsonville | 2.9 | 19,706 |
| 10 | Greenville | 2.7 | 61,734 |
| 11 | Fountain Inn | 2.7 | 8,399 |
| 12 | Gantt | 2.6 | 14,693 |
| 13 | Seneca | 2.6 | 8,184 |
| 14 | Piedmont | 2.5 | 5,648 |
| 15 | Chester | 2.5 | 5,527 |
| 16 | Parker | 2.3 | 12,571 |
| 17 | Union | 2.3 | 8,144 |
| 18 | Clemson | 2.2 | 14,664 |
| 19 | Clover | 2.2 | 5,442 |
| 20 | Berea | 2.1 | 14,091 |
| 21 | Fort Mill | 2.1 | 12,525 |
| 22 | Valley Falls | 2.0 | 5,885 |
| 23 | Laurens | 1.9 | 9,122 |
| 24 | Gaffney | 1.8 | 12,562 |
| 25 | York | 1.8 | 7,945 |
| 26 | Central | 1.8 | 5,160 |
| 27 | Spartanburg | 1.7 | 37,465 |
| 28 | Lancaster | 1.7 | 8,853 |
| 29 | Clinton | 1.7 | 8,561 |
| 30 | Centerville | 1.6 | 6,806 |
| 31 | Homeland Park | 1.6 | 6,419 |
| 32 | Lake Wylie | 1.5 | 10,738 |
| 33 | Powdersville | 1.5 | 8,230 |
| 34 | Anderson | 1.4 | 26,978 |
| 35 | Boiling Springs | 1.4 | 8,743 |
| 36 | Tega Cay | 1.4 | 8,609 |
| 37 | Easley | 1.2 | 20,374 |
| 38 | North Myrtle Beach | 1.2 | 14,824 |
| 39 | Oak Grove | 1.2 | 10,183 |
| 40 | Little River | 1.2 | 9,617 |
| 41 | Dillon | 1.2 | 6,705 |
| 42 | West Columbia | 1.1 | 15,757 |
| 43 | Lake Murray Of Richland | 1.1 | 5,915 |
| 44 | Florence | 1.0 | 38,000 |
| 45 | Myrtle Beach | 1.0 | 29,198 |
| 46 | Greenwood | 1.0 | 23,254 |
| 47 | St. Andrews | 1.0 | 21,779 |
| 48 | Lexington | 1.0 | 19,447 |
| 49 | Seven Oaks | 1.0 | 16,185 |
| 50 | Cayce | 1.0 | 13,554 |
| 51 | Newberry | 1.0 | 10,279 |
| 52 | Garden City | 1.0 | 9,246 |
| 53 | Red Bank | 1.0 | 8,920 |
| 54 | Bennettsville | 1.0 | 8,834 |
| 55 | Marion | 1.0 | 6,793 |
| 56 | Batesburg-Leesville | 1.0 | 5,251 |
| 57 | Irmo | 0.9 | 11,704 |
| 58 | Lake City | 0.9 | 6,728 |
| 59 | Cheraw | 0.9 | 5,800 |
| 60 | North Augusta | 0.8 | 22,037 |
| 61 | Conway | 0.8 | 19,356 |
| 62 | Red Hill | 0.8 | 14,357 |
| 63 | Abbeville | 0.8 | 5,197 |
| 64 | Forestbrook | 0.8 | 5,111 |
| 65 | Summerville | 0.7 | 46,200 |
| 66 | Forest Acres | 0.7 | 10,545 |
| 67 | Woodfield | 0.7 | 9,776 |
| 68 | Belvedere | 0.7 | 5,706 |
| 69 | Columbia | 0.6 | 131,958 |
| 70 | Sumter | 0.6 | 40,851 |
| 71 | Aiken | 0.6 | 30,183 |
| 72 | Socastee | 0.6 | 21,641 |
| 73 | Ladson | 0.6 | 14,770 |
| 74 | Murrells Inlet | 0.6 | 8,823 |
| 75 | Darlington | 0.6 | 6,212 |
| 76 | North Charleston | 0.5 | 104,146 |
| 77 | Hanahan | 0.5 | 19,707 |
| 78 | Dentsville | 0.5 | 14,151 |
| 79 | Hartsville | 0.5 | 7,851 |
| 80 | Goose Creek | 0.4 | 39,408 |
| 81 | Sangaree | 0.4 | 8,157 |
| 82 | Camden | 0.4 | 6,982 |
| 83 | Charleston | 0.3 | 127,694 |
| 84 | James Island | 0.3 | 11,544 |
| 85 | Moncks Corner | 0.3 | 9,108 |
| 86 | Georgetown | 0.3 | 9,079 |
| 87 | Lugoff | 0.3 | 8,248 |
| 88 | Mount Pleasant | 0.2 | 74,952 |
| 89 | Hilton Head Island | 0.2 | 39,071 |
| 90 | Bluffton | 0.2 | 14,607 |
| 91 | Orangeburg | 0.2 | 13,685 |
| 92 | Beaufort | 0.2 | 12,839 |
| 93 | Port Royal | 0.2 | 11,513 |
| 94 | Laurel Bay | 0.2 | 6,318 |
| 95 | Burton | 0.2 | 6,266 |
| 96 | Walterboro | 0.2 | 5,312 |

