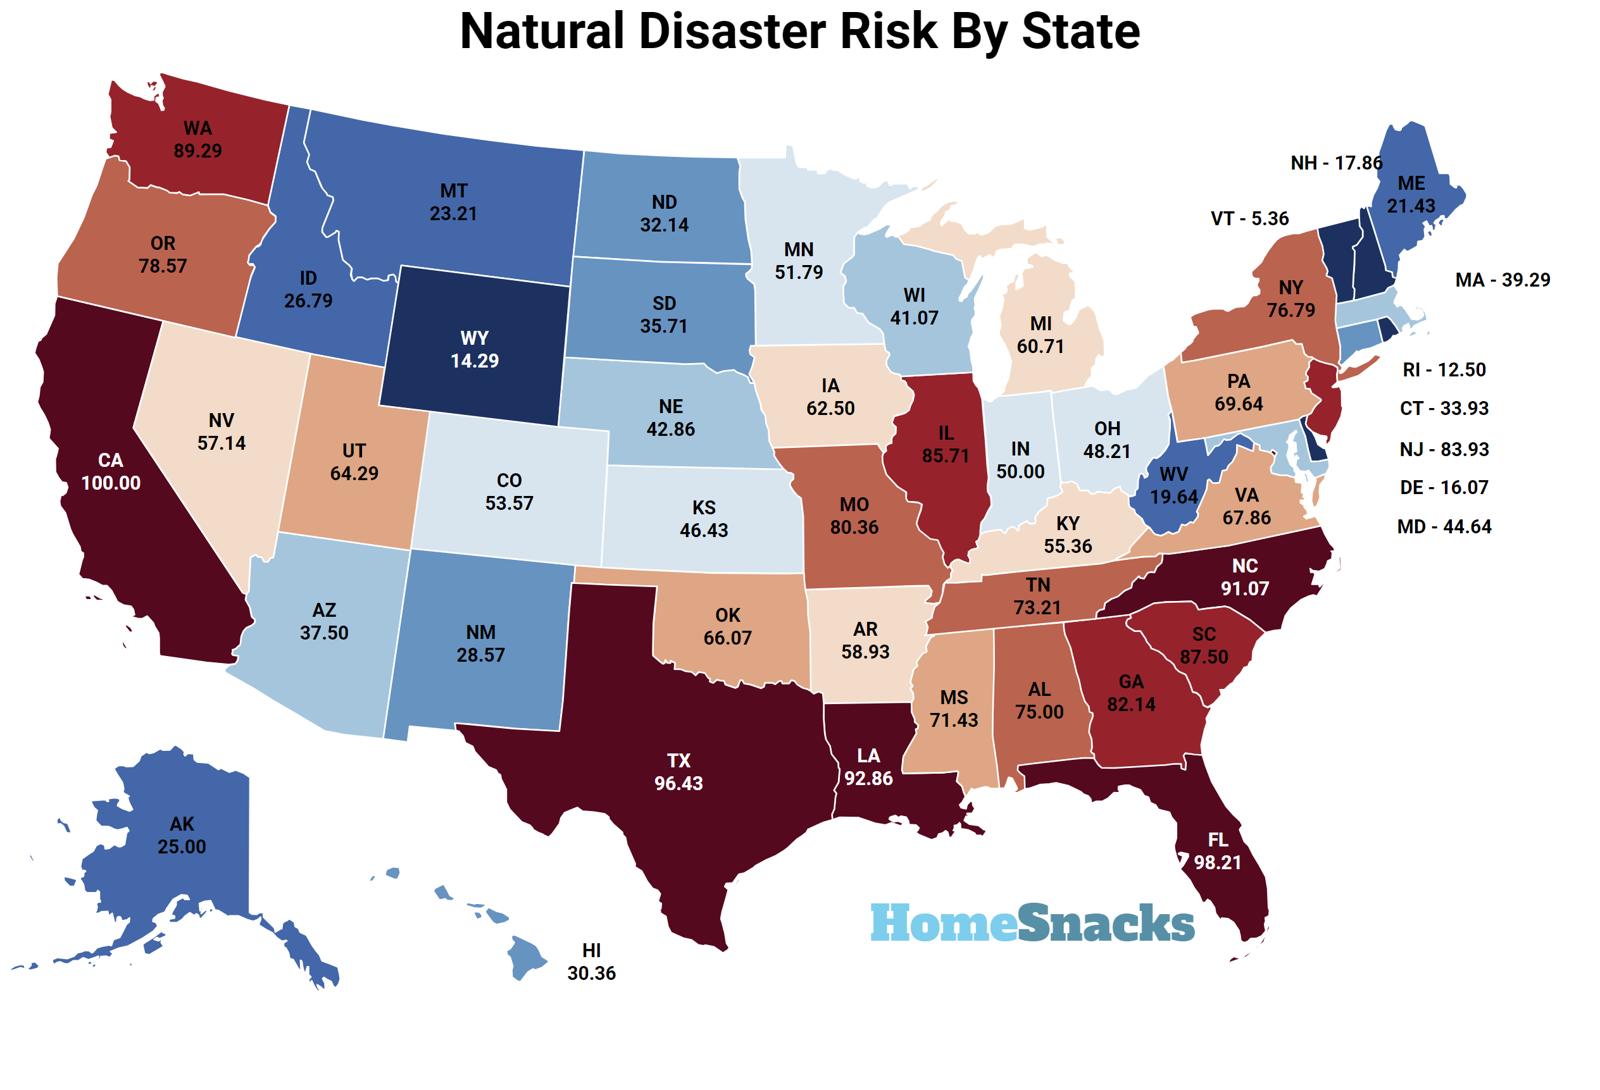
Fire season. Tornado season. Hurricane season. Flooding season. Riot season. Seems like there’s a season for everything here in America, doesn’t it?
Because of our unique geographical and meteorological situation, the United States is a sitting duck for natural weather phenomena. Tornadoes thrive here, hurricanes steer here, it rains a ton, and the west coast is set up perfectly for hot, windy fire seasons every fall.
Of all countries with the MOST natural disasters, only China and India have more of them. Why? Just like us, these countries have large populations on the coast, and are prone to earthquakes, tropical storms, and flooding.
Sort of just bad luck in terms of where you’re located on the planet I suppose.
Anyways, we’re talking about America, so back to that. Here in the US, when you’re measuring the total number of natural disasters, there are ten states which are responsible for a third of disasters and damages. Of course, many of these will be the biggest states and the most populated states, but there’s some surprises in here too.
Table Of Contents: Top Ten | Methodology | Table | Summary
10 States With The Highest Natural Disaster Risk
So, grab your get out bag and get the insurance company on speed dial, we’re going to talk about the disaster capitals of America.
For more reading, check out:
The 10 States With The Most Natural Disasters In America For 2023
1. California
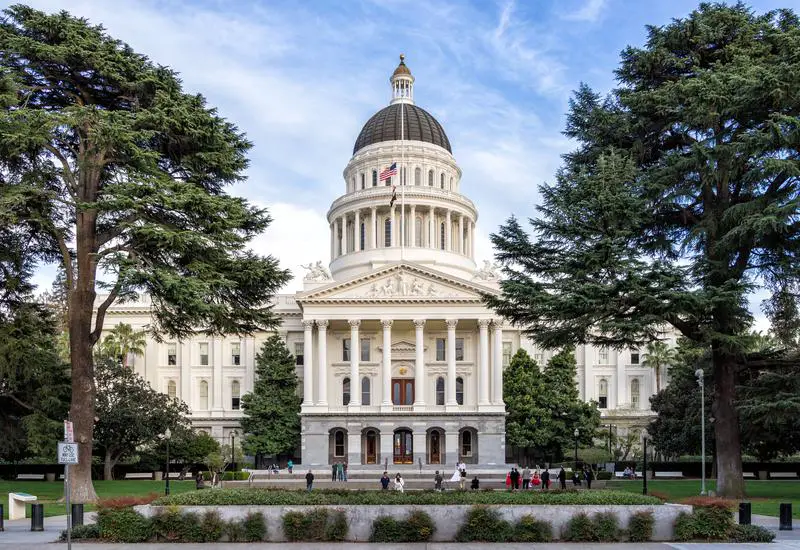
Population: 39,455,353
National Risk Index – Score: 100.00
Building Value ($): $6,898,357,304,405
Agriculture Value ($): $51,791,396,255
Speaking of earthquakes – you can’t talk about those without talking about California.
Now I grew up here, and as a kid, there were earthquakes all the time – usually in the middle of the night. And they were big – enough to scare you into running out into the front yard. They’ve had some really big ones here – the most memorable of which were both in San Francisco – in 1906, which pretty much wiped out like the whole city, and in 1989, which happened during the World Series.
I actually felt that one all the way down in my hometown of Highland, which is a long long way away.
Now, the ground’s been eerily quiet. California’s going through an earthquake drought in case you didn’t know. Well, if you live there you know, cause you’re getting ready for the BIG ONE.
But it’s not just earthquakes. It’s floods and dam breakings and freezing and biological warfare and droughts and fishing losses and a hurricane. And tsunamis.
And of course fires. This state goes up in flames every fall.
No wonder everyone’s leaving this state.
2. Florida
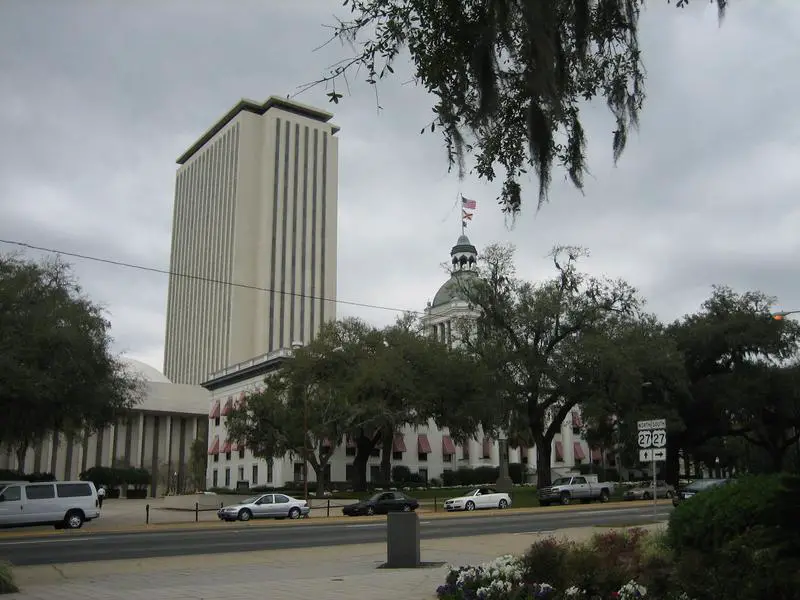
Population: 21,339,762
National Risk Index – Score: 98.21
Building Value ($): $3,253,523,487,667
Agriculture Value ($): $8,438,830,960
Florida has FEMA on speed dial. The weather here is almost as crazy as the people.
Many of this state’s natural disasters have been fires, but 44 of them have been hurricanes, by far the most of any other state. Dozens of tropical systems have destroyed this state over the past 60 years. Hurricane Andrew in 1992 was a category 5 (look at this thing) which had gusts of 200 miles an hour, which at the time, was the most expensive natural disaster in US history, up until Katrina.
For a long time, hurricanes didn’t even have names. And then they started naming them. Easy was a name of a hurricane. That probably didn’t scare people – why would you name a hurricane Easy? You want people to get prepared, right? Eloise, Opal, Wilma – why do they name these after old ladies.
And they count severe freezes as natural disasters because they wreck such havoc on the state’s citrus crops. In 1985, Florida saw the ‘Freeze of the Century’ which damaged 90% of the state’s oranges and grapefruits. Grapefruit I’m okay with those are gross. But orranges – those are a shame to lose.
Anyways, Florida has gone through a lot over the years, and will undoubtedly go through many, many more disasters over time, so stay on your toes Florida.


I live in Florida so I’m used to the hot weather, I literally used to wear lots of sweaters and jackets when it was hot outside so elementary schools like mine banned them in spring
3. Texas
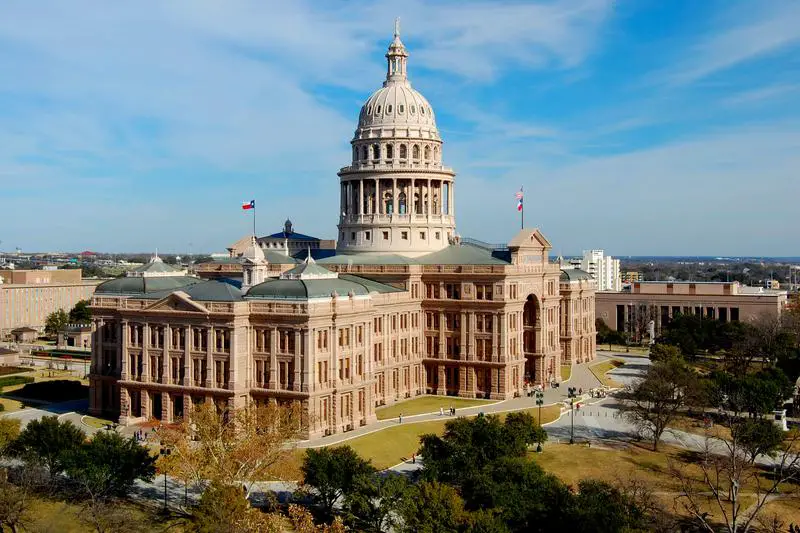
Population: 28,862,581
National Risk Index – Score: 96.43
Building Value ($): $4,833,632,977,799
Agriculture Value ($): $28,587,435,651
Which state is the one of the most natural disastery? Texas is. The Lone Star state has seen 358 natural disasters since 1953 alone, and 86 of em were MAJOR disaster declarations.
Moments Texans would love to forget go way back to 1900 when the Galveston hurricane came on land and wiped out a ton of stuff. There was the 1953 Waco tornado, the 1950s Texas draught, the 2004 Christmas Eve blizzard, the 2009 Christmas blizzard (why are all of these blizzards on Christmas?), the Black Sunday storm, and of course hurricane after hurricane and tropical storms after tropical storms.
Then there’s hurricane Harvey. Hurricane Harvey dumped 60 inches of rain in some parts of Texas, and some areas have not and will not ever recover from that.
But, despite all of this, Americans have decided Texas is the bees knees, and more people flock here than any other state right now. And more people means more devastation when these natural disasters inevitably come this way.


I live in Texas I have a better quality of life here then in Cali Come on
4. Louisiana

Population: 4,657,305
National Risk Index – Score: 92.86
Building Value ($): $837,517,894,603
Agriculture Value ($): $3,639,362,585
Of course Louisiana is on here. This is home to Hurricane Katrina, which will live as the most infamous hurricane in American history until another one comes that’s even bigger. Katrina smacked this state like it owed her money. Louisiana still hasn’t recovered from Hurricane Katrina, which killed almost 1,000 people and caused tens of billions in damage and sent residents fleeing all the way to Alaska. Many still live in the Houston metro area.
This gulf state has been hit by numerous hurricanes over the years. Rita, Ike, Betsy, Juan, Camille, Flossy (that’s a real hurricane – isn’t that a dance?), Florence, Florence again, Nate, Isidore, Ida, Hilda, Humberto, okay there’s been a lot.
And, apparently, two snow-related natural disasters messed up Louisiana, although I bet those were probably like two inch storms? Cause people in the south can’t drive in the snow and you can’t blame them for that.
In all, Louisiana has had 87 natural disasters in her recorded history, which is far more than once a year.


I live in Louisiana and I love it. Just based on the stuff you used to make the list, like weather and bugs, Louisiana should be #1.
We have over 50% of the entire country’s wetlands, which makes it a major hotspot for mosquitoes, Crime rate is pretty high, and poverty is really high. Drugs are also a problem.
5. North Carolina

Population: 10,367,022
National Risk Index – Score: 91.07
Building Value ($): $2,007,481,757,947
Agriculture Value ($): $14,796,960,872


I was born in north carolina but grew up in florida. It wasnt bad then, but heard from my dad it gotten worse. Ive lived in alabama and where i lived was a bump, no lie. Lived in myrtle beach in south carolina and there was a murder in the trailer across from where i lived in the same trailer park. Ive lived in alot of places in north carolina since ive been back and nothing is getring much better here either, the crime rate in burlington has gone up and asheboro is slowly getting there with the crime as well.
6. Washington

Population: 7,617,364
National Risk Index – Score: 89.29
Building Value ($): $1,465,946,943,448
Agriculture Value ($): $11,050,910,919
7. South Carolina
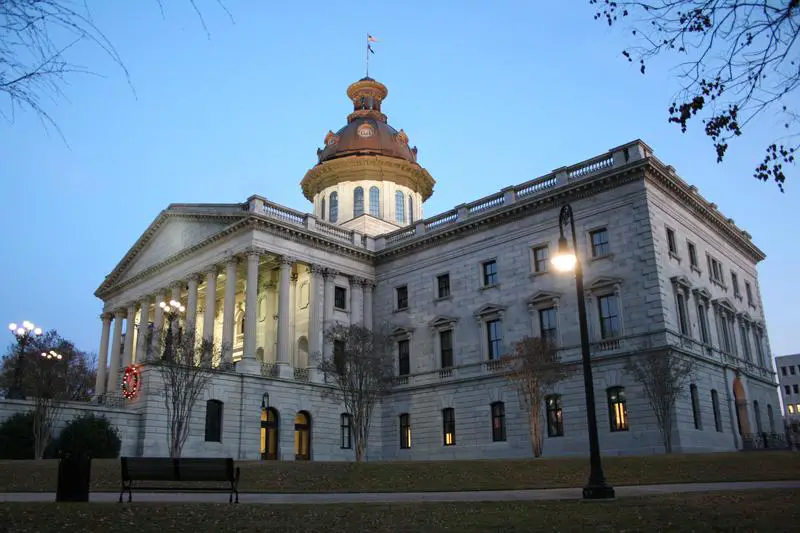
Population: 5,078,903
National Risk Index – Score: 87.50
Building Value ($): $1,013,337,080,199
Agriculture Value ($): $3,450,978,181


I was born and raised in South Carolina first off. There are a lot of angry comments it’s on this video from people who are from South Carolina. I have read things that make me believe people didn’t even watch the video.
This guy probably is not from South Carolina nor has he probably ever been here that is true. However there are videos about the worst of other states as well this is not specifically to destroy South Carolina’s reputation. He did also say in the beginning good things about areas in South Carolina. Every state has bad areas South Carolina is no different.
This video was made on statistics. Facts on crime employment rate and income. There are many towns in this state which I feel should have made this list. But everyone needs to understand this… you can’t get angry at someone for reading out statistical facts. I am sorry if it hurt your feelings. But please stop wasting time being upset and denying that these facts are true and start working on ways to make your town better. As long as everyone is denying that there is a problem the problem will never be solved. This is a general statement to everyone and Anyone who reads it.
Not specifically intended for those who live in South Carolina. Don’t fight the truth fight for change put your feelings aside and think logically and rationally.
8. Illinois

Population: 12,821,813
National Risk Index – Score: 85.71
Building Value ($): $2,684,495,069,855
Agriculture Value ($): $19,510,224,268
9. New Jersey

Population: 9,234,024
National Risk Index – Score: 83.93
Building Value ($): $1,754,652,382,506
Agriculture Value ($): $1,259,343,017


I lived in New Jersey. You didn’t mention Trenton/Hamilton. Those are two of the least safe cities in the whole state, I know from experience.
I lived in the town of Princeton, probably one of the best towns in the state, though. I’d seriously suggest living there, it’s safe and has great schools. Just don’t live in Trenton/Hamilton, Camden, or Newark.
10. Georgia

Population: 10,625,615
National Risk Index – Score: 82.14
Building Value ($): $1,993,773,894,630
Agriculture Value ($): $10,980,489,763


There are MANY other, more interesting places to go in Georgia than Atlanta! Also, California’s traffic is ten time worse. I’ve lived in both cali and ga and I personally like Georgia way more! Savanna is a great place, St. Simon’s island is a beautiful place, let’s not forget about the entire northern part of Georgia! Georgia is one of the most Beautiful states in America! It should be no where near this list!
Methodology: How did we determine the states with the most natural disasters for 2023?
To determine the states with the most natural disasters in the United States, we used Saturday Night Science to look at FEMA’s National Risk Index.
The National Risk Index features a score for each state that compares the probability of disaster with the impact of natural disasters. This index considers the population, building, and land values within the state’s borders.
What state is the most likely to have a major disaster? The state with the highest chance for a natural disaster is California.
Wrapping Up The States With The Most Natural Disasters
That’s a small rundown of the natural disasters which have made their mark on the United States, and the states in which they happen most often. If you live in one of these states, then you should probably leave right now because you are not safe, mister.
If you’re in areas like Michigan or Montana or North Dakota, where you hardly get any fires or earthquakes or tornadoes, or hurricanes, you’re lucky. You can live your quiet peaceful life knowing nothing is going to sneak up on you and make your life miserable – or end it.
In just about every pocket of this country though, you’re at risk for a disaster. Manmade or otherwise.
For more reading, check out:
States With The Most Natural Disasters In The US For 2023
| Rank | State | Population | Risk Index | Building Value | Agriculture Value |
|---|---|---|---|---|---|
| 1 | California | 39,455,353 | 100.00 | $6,898,357,304,405 | $51,791,396,255 |
| 2 | Florida | 21,339,762 | 98.21 | $3,253,523,487,667 | $8,438,830,960 |
| 3 | Texas | 28,862,581 | 96.43 | $4,833,632,977,799 | $28,587,435,651 |
| 4 | Louisiana | 4,657,305 | 92.86 | $837,517,894,603 | $3,639,362,585 |
| 5 | North Carolina | 10,367,022 | 91.07 | $2,007,481,757,947 | $14,796,960,872 |
| 6 | Washington | 7,617,364 | 89.29 | $1,465,946,943,448 | $11,050,910,919 |
| 7 | South Carolina | 5,078,903 | 87.50 | $1,013,337,080,199 | $3,450,978,181 |
| 8 | Illinois | 12,821,813 | 85.71 | $2,684,495,069,855 | $19,510,224,268 |
| 9 | New Jersey | 9,234,024 | 83.93 | $1,754,652,382,506 | $1,259,343,017 |
| 10 | Georgia | 10,625,615 | 82.14 | $1,993,773,894,630 | $10,980,489,763 |
| 11 | Missouri | 6,141,534 | 80.36 | $1,315,944,392,077 | $12,073,499,360 |
| 12 | Oregon | 4,207,177 | 78.57 | $899,649,257,374 | $5,742,913,318 |
| 13 | New York | 20,114,745 | 76.79 | $3,345,186,456,840 | $6,158,706,187 |
| 14 | Alabama | 4,997,675 | 75.00 | $931,278,699,041 | $6,859,651,997 |
| 15 | Tennessee | 6,859,497 | 73.21 | $1,209,223,659,136 | $4,357,526,815 |
| 16 | Mississippi | 2,967,023 | 71.43 | $530,941,878,798 | $7,106,524,116 |
| 17 | Pennsylvania | 12,970,650 | 69.64 | $2,712,099,791,394 | $8,899,244,927 |
| 18 | Virginia | 8,582,479 | 67.86 | $1,475,485,606,720 | $4,542,609,776 |
| 19 | Oklahoma | 3,948,136 | 66.07 | $636,212,966,527 | $8,562,896,240 |
| 20 | Utah | 3,231,370 | 64.29 | $500,105,582,355 | $2,108,854,888 |
| 21 | Iowa | 3,179,090 | 62.50 | $758,530,632,753 | $33,212,624,296 |
| 22 | Michigan | 10,062,512 | 60.71 | $2,053,932,845,208 | $9,429,243,814 |
| 23 | Arkansas | 3,006,309 | 58.93 | $531,641,631,361 | $11,069,543,507 |
| 24 | Nevada | 3,059,238 | 57.14 | $559,645,565,699 | $763,680,938 |
| 25 | Kentucky | 4,494,141 | 55.36 | $844,997,445,801 | $6,581,491,994 |
| 26 | Colorado | 5,723,176 | 53.57 | $1,035,113,377,482 | $8,592,360,391 |
| 27 | Minnesota | 5,670,472 | 51.79 | $1,317,164,320,087 | $21,099,270,975 |
| 28 | Indiana | 6,751,340 | 50.00 | $1,370,952,310,513 | $12,739,797,037 |
| 29 | Ohio | 11,769,923 | 48.21 | $2,381,567,460,093 | $10,714,185,786 |
| 30 | Kansas | 2,932,099 | 46.43 | $673,550,663,350 | $21,543,601,181 |
| 31 | Maryland | 6,148,545 | 44.64 | $1,034,617,894,565 | $2,836,339,233 |
| 32 | Nebraska | 1,951,480 | 42.86 | $410,426,709,089 | $25,214,568,024 |
| 33 | Wisconsin | 5,871,661 | 41.07 | $1,419,662,607,328 | $13,107,320,255 |
| 34 | Massachusetts | 6,991,852 | 39.29 | $1,274,506,416,229 | $545,032,595 |
| 35 | Arizona | 7,079,203 | 37.50 | $1,210,747,048,519 | $4,418,227,706 |
| 36 | South Dakota | 881,785 | 35.71 | $263,661,681,148 | $11,150,696,543 |
| 37 | Connecticut | 3,605,330 | 33.93 | $706,240,893,571 | $665,382,123 |
| 38 | North Dakota | 773,344 | 32.14 | $245,600,036,945 | $9,444,151,645 |
| 39 | Hawaii | 1,453,498 | 30.36 | $227,861,650,996 | $646,624,020 |
| 40 | New Mexico | 2,109,366 | 28.57 | $441,483,343,259 | $2,961,914,541 |
| 41 | Idaho | 1,811,617 | 26.79 | $365,114,021,078 | $8,679,561,801 |
| 42 | Alaska | 735,951 | 25.00 | $179,066,231,249 | $80,660,337 |
| 43 | Montana | 1,077,978 | 23.21 | $269,404,529,524 | $4,038,175,221 |
| 44 | Maine | 1,357,046 | 21.43 | $282,825,971,895 | $765,029,475 |
| 45 | West Virginia | 1,801,049 | 19.64 | $358,394,126,018 | $865,132,729 |
| 46 | New Hampshire | 1,372,175 | 17.86 | $259,764,888,441 | $215,411,360 |
| 47 | Delaware | 981,892 | 16.07 | $221,227,974,415 | $1,681,481,715 |
| 48 | Wyoming | 576,641 | 14.29 | $133,240,897,777 | $1,688,559,238 |
| 49 | Rhode Island | 1,091,949 | 12.50 | $189,779,236,772 | $66,525,539 |
| 50 | Vermont | 641,637 | 5.36 | $155,114,646,356 | $895,799,313 |


