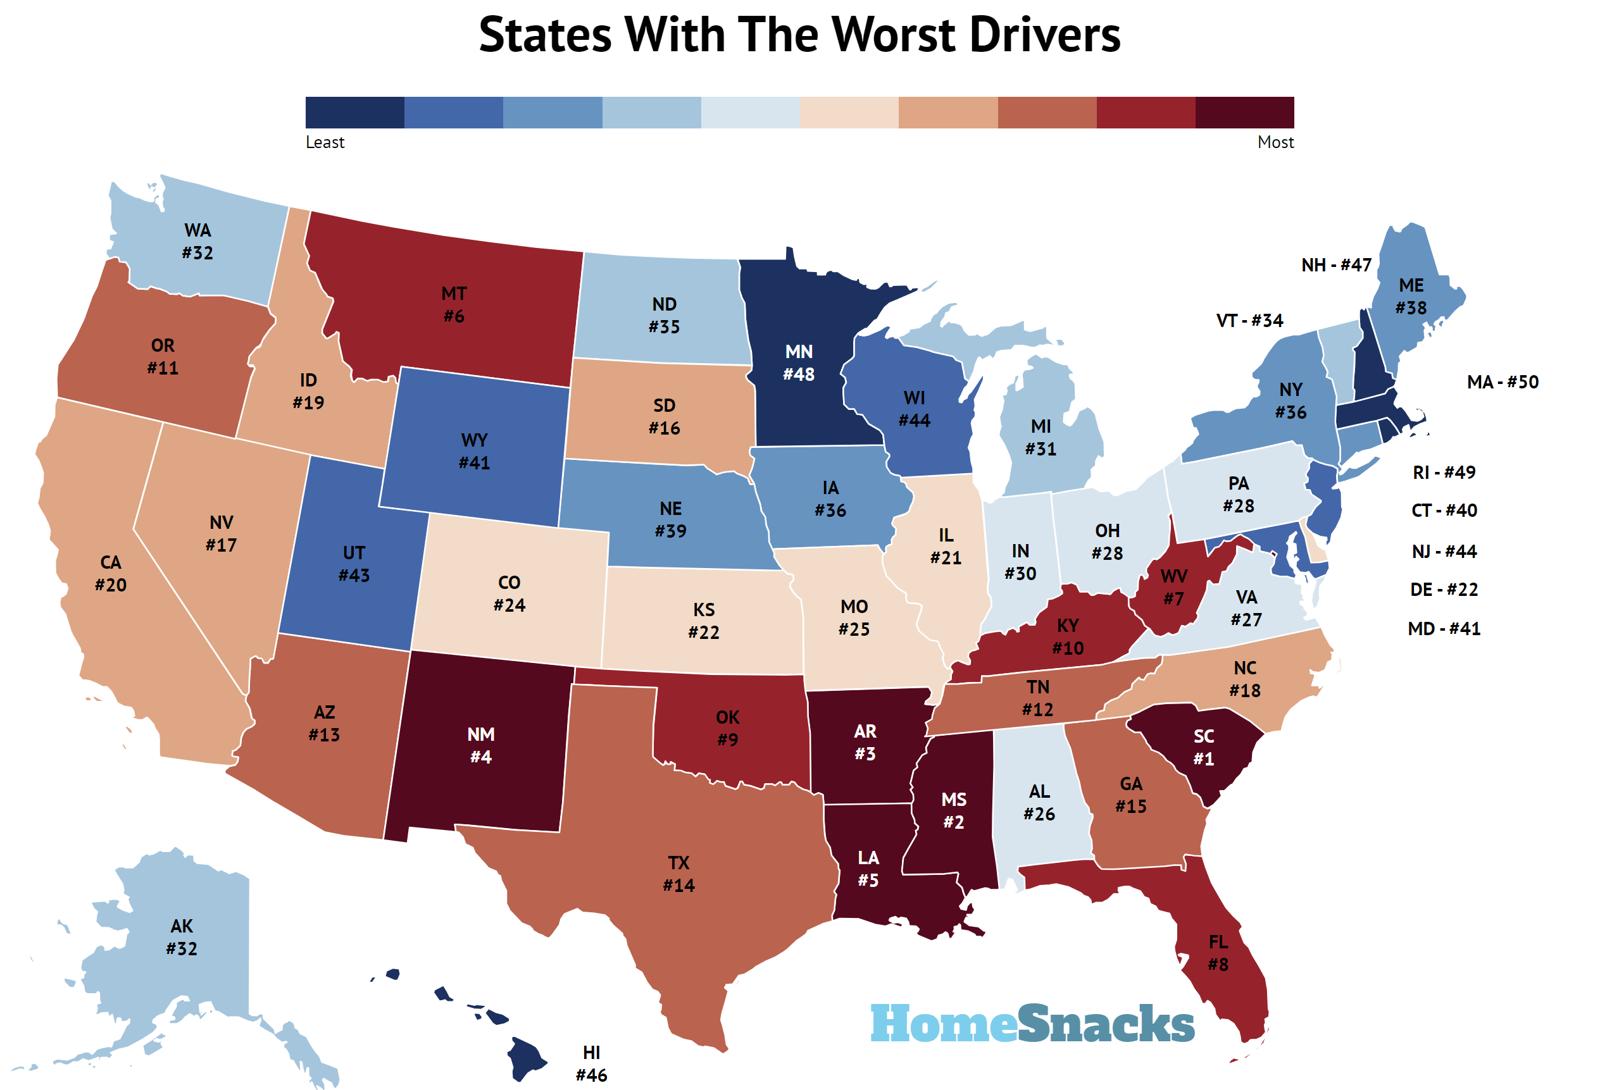
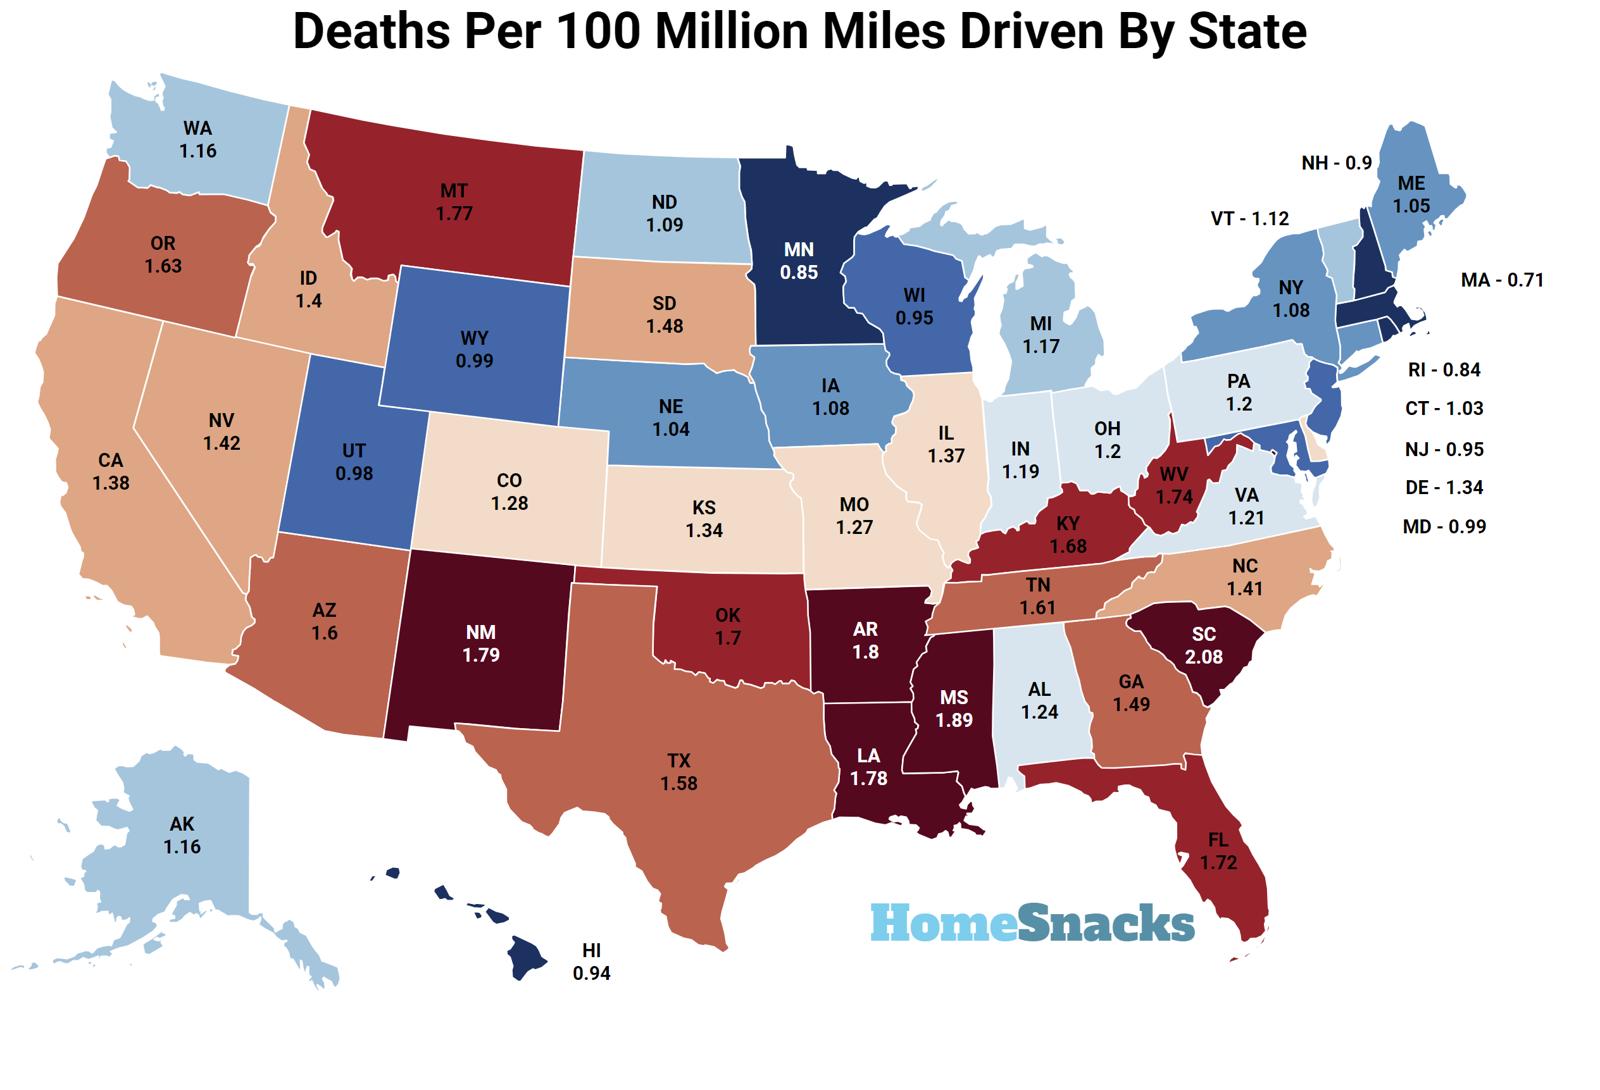
Wow, Americans sure are bad drivers.
We either don’t care. Don’t know how to drive or likely both. I’m a pretty good driver, I must say. But I think most people think they are, too.
Today, we will examine the states with the worst drivers of all. To determine this assumption, we measured four different things. We look at the number of uninsured people, DUIs, tickets, and accidents by state.
Add it all up, and you can tell the states you can drive around safely and the states you need to drive very defensively.
Table Of Contents: Top Ten | Methodology | Table | Summary
The 10 States With The Worst Drivers
If you’re curious – and I know you are – the states with the highest rates of drunken drivers are BY FAR South Dakota and North Dakota, with Hawaii and Wisconsin a distant third and fourth.
Now, I have friends in North Dakota, and I’ve seen firsthand how inebriated people hop in their cars and drive home almost every night of the week. Monday Funday. Tuesday Funday. Wednesday Funday. It never ends up there.
For more reading, check out:
The 10 States With The Worst Drivers In America
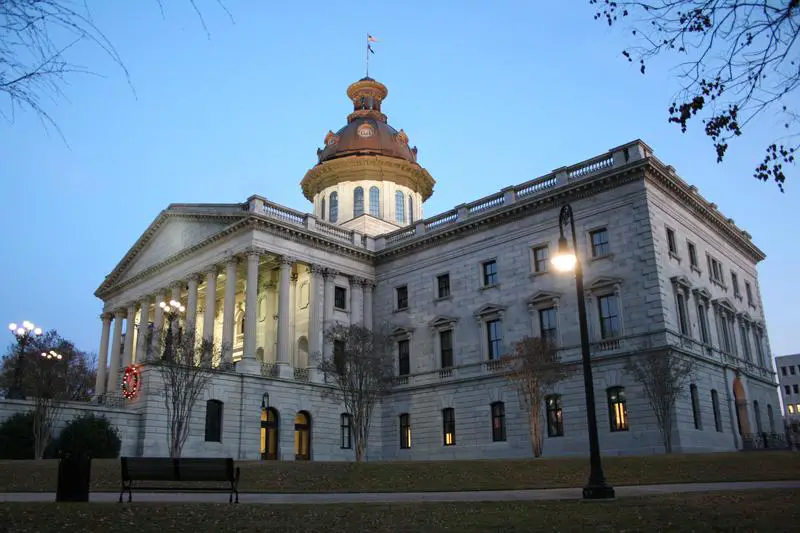
1. South Carolina
Population: 5,078,903
Miles Driven (in millions): 57,492
Fatal Crashes: 1,112
Deaths: 1,198
Deaths per 100 million miles: 2.08


Many years ago I was in SC and I loved it. Absence makes the heart grow fonder… After all these years I am finally returning to south carolina – we are moving out of Income tax… all the way from Pa. You will not discourage me in the least… I can’t understand what your goal here is… If you can’t say anything good then why did you feel compelled to say anything at all. If all you can see is the negatives… you will see them everywhere – even in your hometown or neighborhood.
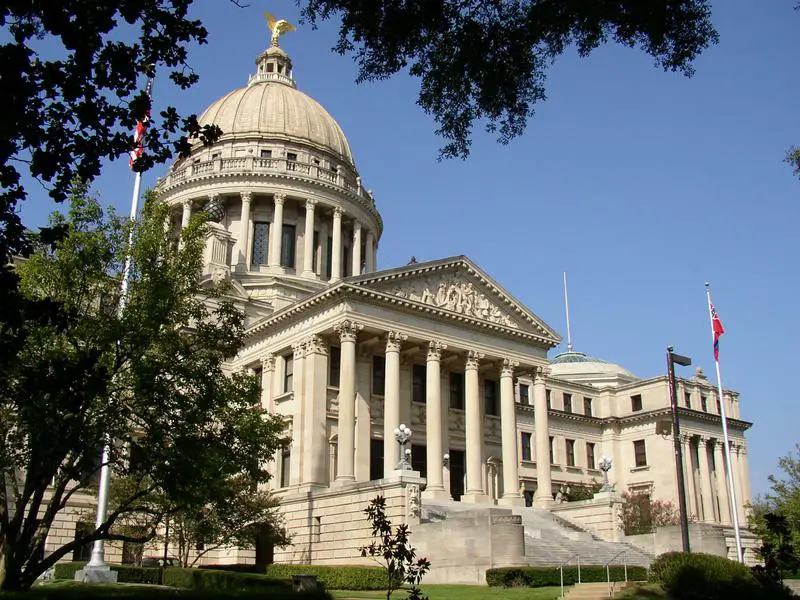
2. Mississippi
Population: 2,967,023
Miles Driven (in millions): 40,853
Fatal Crashes: 697
Deaths: 772
Deaths per 100 million miles: 1.89
These folks are just plain all over the road. And in the ditch. And behind bars. Only 3 in 4 people have car insurance here? What the? They get the 8th most tickets. And Mississippi drivers die in car wrecks the second most often, only behind Kentucky.
The only bright side here is that like in Alabama, far fewer Mississippi drivers get behind the wheel after drinking. Thank God.
If you live in Mississippi you should be ashamed of yourself and you should pull over right now. Cause you’re probably watching this video while on your way to work.


Okay hold up.
So what again makes Mississippi the worst-
Seriously the only reason was weather, unemployment, and
Money-
Okay, yeah, screw this guy from the Magnolia State. It’s not that bad here guys. Seriously just shut up dude, we are not the worst state. Our schools are awesome as well! A+ schools and one of the schools in Mississippi got #1 in the nation for 7th Grade math. In my opinion,
Note: *OPINION*
Mississippi is the best state to live in. I’ve lived here all my life and I don’t plan on moving.
3. Arkansas
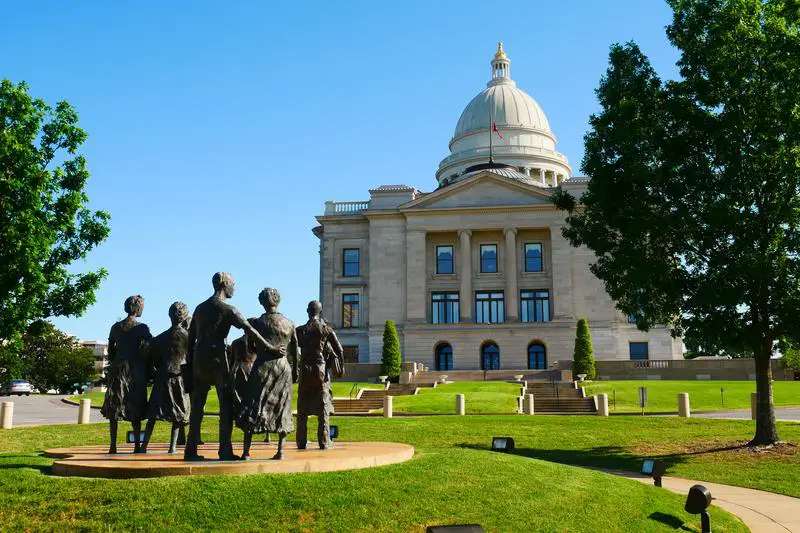
Population: 3,006,309
Miles Driven (in millions): 38,427
Fatal Crashes: 631
Deaths: 693
Deaths per 100 million miles: 1.8


Arkansas is beautiful! I’m from Texas and had to leave. Way to crowded! One thing you have in Arkansas less people! Which makes it great! You won’t find a prettier place to live. NW Arkansas is heaven.
4. New Mexico

Population: 2,109,366
Miles Driven (in millions): 26,823
Fatal Crashes: 427
Deaths: 481
Deaths per 100 million miles: 1.79


I live in New Mexico and honestly you described a city. Albuquerque is where majority of the population is and where 1/2 the crime happens. Most places are small towns where not much goes on. And New Mexico is one of the most beautiful landscapes in the whole country. Lots of Volcanoes. Lates, mountains. Also some of the best food someone could ever have. Except it sounds like you wouldn’t be able to handle even the red chili lol
5. Louisiana

Population: 4,657,305
Miles Driven (in millions): 54,728
Fatal Crashes: 887
Deaths: 972
Deaths per 100 million miles: 1.78


I live in Louisiana and I love it. Just based on the stuff you used to make the list, like weather and bugs, Louisiana should be #1.
We have over 50% of the entire country’s wetlands, which makes it a major hotspot for mosquitoes, Crime rate is pretty high, and poverty is really high. Drugs are also a problem.
6. Montana

Population: 1,077,978
Miles Driven (in millions): 13,482
Fatal Crashes: 222
Deaths: 239
Deaths per 100 million miles: 1.77
7. West Virginia

Population: 1,801,049
Miles Driven (in millions): 16,079
Fatal Crashes: 257
Deaths: 280
Deaths per 100 million miles: 1.74


Wtf everything this guy said about West Virginia is completely false I bet he didn’t even go to WV…it’s practically always sunny…and no there are rarely and houses for sail and even though I live in Pennsylvania,my fam lives there and I see them 5x a year and it’s so awesome to be there
And Florida is also amazing I love Florida
And u didn’t put cali on there well u got a big thumbs down from me
8. Florida
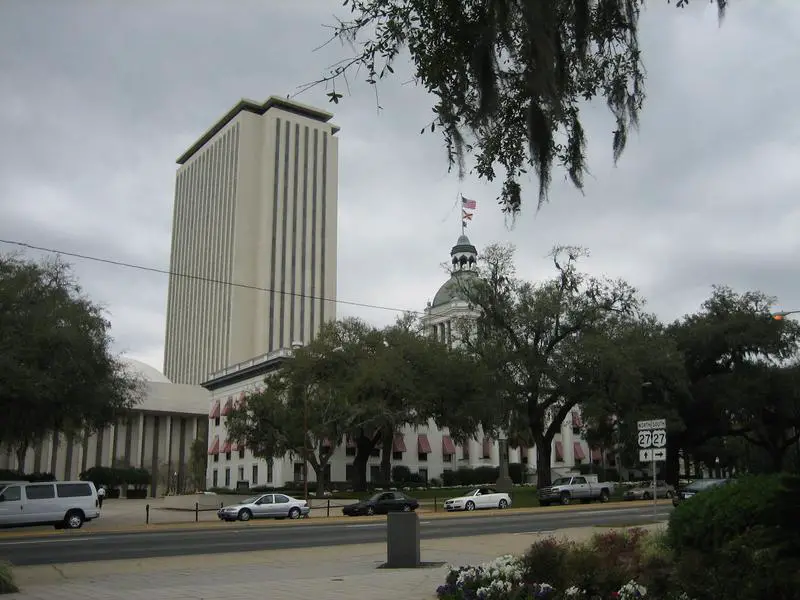
Population: 21,339,762
Miles Driven (in millions): 217,566
Fatal Crashes: 3,451
Deaths: 3,738
Deaths per 100 million miles: 1.72
Hey I’m driving my car in Florida now. Looking for a Publix and country music party. Man the weather is fairly nice. Look at that pretty sunset.
Of course Florida ranks high on this list. When’s the last time you drove here? Every time I drive to Florida, it’s immediately clear when I’m IN Florida – like as soon as I cross into Florida from Georgia the driving gets really interesting. Like crazy people going 100, going across 4 lanes at a time…tons of people here drivin in like they stole it. Or the opposite.
Numbers wise, it ain’t purty. Florida has the MOST uninsured drivers in the nation at 27%. But, conversely, Florida has the 8th lowest number of DUI cases each year, which is interesting. Floridians drivers also get the 10th most traffic tickets every year.
You could say that Florida drivers are mostly transplants and old people. None of which really abide by or even understand local traffic laws.


Honestly i dont get why people say Florida is bad i live in Florida and there arent as many ask mosquitoes as people think there are! i really hate the media!
9. Oklahoma
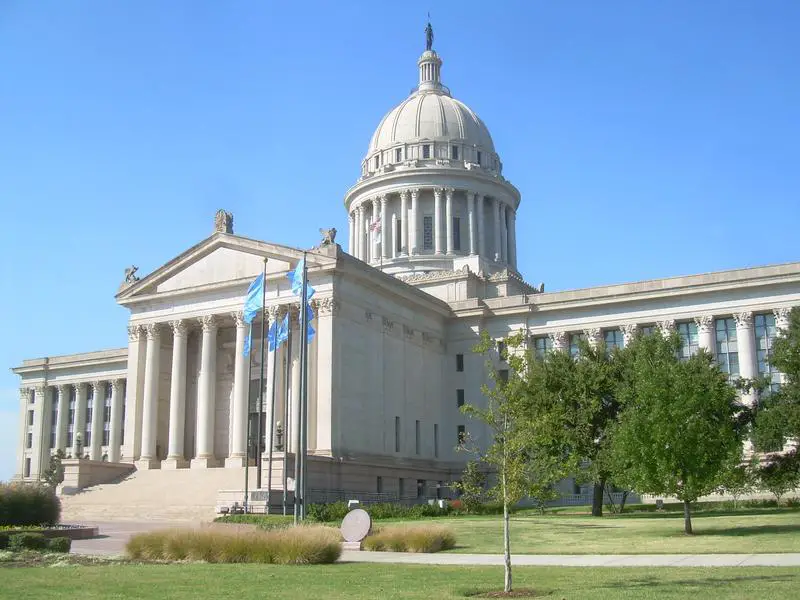
Population: 3,948,136
Miles Driven (in millions): 44,760
Fatal Crashes: 681
Deaths: 762
Deaths per 100 million miles: 1.7


So I live in Oklahoma and I can see why property theft numbers would make it a bad place to live, but why would number of health uninsured and female prison population make this a bad state to live- More to the point it would be nice if you would mention why living in Oklahoma City or Tulsa would be bad. You make it seem like Oklahoma is only rural areas,
10. Kentucky

Population: 4,494,141
Miles Driven (in millions): 48,111
Fatal Crashes: 734
Deaths: 806
Deaths per 100 million miles: 1.68


I live in Kentucky in a little hick town that’s only about twelve miles from the Ky tenn state line and am in a rural area and you call the sheriff for whatever reason,they might come and then they might not!!!!!!!!!
Methodology: How did we determine the states with the worst divers for 2023?
To determine the states with the worst drivers in the United States, we used Saturday Night Science to look at the National Highway Traffic Safety Administration’s Summary of Motor Vehicle Traffic Crashes. This report provides data on the number of miles driven by state, fatal crashes by state, and total deaths from crashes by state.
We divided their total deaths from crashes by the miles driven to get the deaths per mile driven rate. Finally, because that number is so small, we multiplied it by 100 million to get the number of fatalities per 100 million miles driven. We then ranked each state on this metric from highest to lowest.
What state has the worst drivers? The state with the worst drivers is South Carolina based on deaths per 100 million miles driven.
Wrapping Up The States With The Worst Drivers In America
So that’s it – the states with the worst drivers. If your state isn’t on here, congrats. Though, I’m sure every day you’re out there it feels like your state SHOULD be on this list. And if it seems like your state has GOOD drivers, then likely, YOU’RE the problem, mister.
And in case you’re wondering which state gets the most and least traffic tickets – South Carolina, Iowa and Wyoming people get caught speeding the most. Kentucky and Connecticut people drive the slowest I guess?
In terms of age, younger people clearly have more car accidents than any other age group. But in terms of traffic deaths, the elderly die at a much higher rate. Makes sense.
Finally, which state is the one with the best drivers? – Massachusetts is. Along with Nebraska, Vermont, New York (what), Connecticut, Maine, Rhode Island, New Hampshire. So like almost all of New England except Nebraska has the best drivers? Why do Nebraskans drive so well? That’s weird.
Anyways, hope you enjoyed the video and you learned something. Now SLOW DOWN!
For more reading, check out:
States With The Worst Drivers
| Rank | State | Population | Miles Driven (in millions) | Fatal Crashes | Deaths | Deaths Per 100 Million Miles |
|---|---|---|---|---|---|---|
| 1 | South Carolina | 5,078,903 | 57,492 | 1,112 | 1,198 | 2.08 |
| 2 | Mississippi | 2,967,023 | 40,853 | 697 | 772 | 1.89 |
| 3 | Arkansas | 3,006,309 | 38,427 | 631 | 693 | 1.8 |
| 4 | New Mexico | 2,109,366 | 26,823 | 427 | 481 | 1.79 |
| 5 | Louisiana | 4,657,305 | 54,728 | 887 | 972 | 1.78 |
| 6 | Montana | 1,077,978 | 13,482 | 222 | 239 | 1.77 |
| 7 | West Virginia | 1,801,049 | 16,079 | 257 | 280 | 1.74 |
| 8 | Florida | 21,339,762 | 217,566 | 3,451 | 3,738 | 1.72 |
| 9 | Oklahoma | 3,948,136 | 44,760 | 681 | 762 | 1.7 |
| 10 | Kentucky | 4,494,141 | 48,111 | 734 | 806 | 1.68 |
| 11 | Oregon | 4,207,177 | 36,842 | 552 | 599 | 1.63 |
| 12 | Tennessee | 6,859,497 | 82,596 | 1,229 | 1,327 | 1.61 |
| 13 | Arizona | 7,079,203 | 73,760 | 1,063 | 1,180 | 1.6 |
| 14 | Texas | 28,862,581 | 285,028 | 4,068 | 4,498 | 1.58 |
| 15 | Georgia | 10,625,615 | 120,685 | 1,670 | 1,797 | 1.49 |
| 16 | South Dakota | 881,785 | 9,994 | 131 | 148 | 1.48 |
| 17 | Nevada | 3,059,238 | 27,077 | 360 | 385 | 1.42 |
| 18 | North Carolina | 10,367,022 | 117,734 | 1,535 | 1,663 | 1.41 |
| 19 | Idaho | 1,811,617 | 19,308 | 244 | 271 | 1.4 |
| 20 | California | 39,455,353 | 310,823 | 3,983 | 4,285 | 1.38 |
| 21 | Illinois | 12,821,813 | 97,530 | 1,210 | 1,334 | 1.37 |
| 22 | Delaware | 981,892 | 10,152 | 132 | 136 | 1.34 |
| 23 | Kansas | 2,932,099 | 31,693 | 381 | 424 | 1.34 |
| 24 | Colorado | 5,723,176 | 53,840 | 638 | 691 | 1.28 |
| 25 | Missouri | 6,141,534 | 79,791 | 931 | 1,016 | 1.27 |
| 26 | Alabama | 4,997,675 | 79,569 | 885 | 983 | 1.24 |
| 27 | Virginia | 8,582,479 | 80,102 | 906 | 973 | 1.21 |
| 28 | Pennsylvania | 12,970,650 | 102,686 | 1,153 | 1,230 | 1.2 |
| 29 | Ohio | 11,769,923 | 112,923 | 1,242 | 1,354 | 1.2 |
| 30 | Indiana | 6,751,340 | 78,640 | 863 | 932 | 1.19 |
| 31 | Michigan | 10,062,512 | 96,744 | 1,072 | 1,136 | 1.17 |
| 32 | Alaska | 735,951 | 5,752 | 59 | 67 | 1.16 |
| 33 | Washington | 7,617,364 | 57,797 | 603 | 670 | 1.16 |
| 34 | Vermont | 641,637 | 6,625 | 69 | 74 | 1.12 |
| 35 | North Dakota | 773,344 | 9,256 | 85 | 101 | 1.09 |
| 36 | New York | 20,114,745 | 106,870 | 1,099 | 1,157 | 1.08 |
| 37 | Iowa | 3,179,090 | 33,039 | 329 | 356 | 1.08 |
| 38 | Maine | 1,357,046 | 14,560 | 135 | 153 | 1.05 |
| 39 | Nebraska | 1,951,480 | 21,210 | 192 | 221 | 1.04 |
| 40 | Connecticut | 3,605,330 | 28,989 | 283 | 298 | 1.03 |
| 41 | Maryland | 6,148,545 | 56,601 | 522 | 561 | 0.99 |
| 42 | Wyoming | 576,641 | 11,097 | 102 | 110 | 0.99 |
| 43 | Utah | 3,231,370 | 33,638 | 293 | 328 | 0.98 |
| 44 | Wisconsin | 5,871,661 | 64,983 | 572 | 620 | 0.95 |
| 45 | New Jersey | 9,234,024 | 73,673 | 669 | 699 | 0.95 |
| 46 | Hawaii | 1,453,498 | 9,972 | 94 | 94 | 0.94 |
| 47 | New Hampshire | 1,372,175 | 13,130 | 106 | 118 | 0.9 |
| 48 | Minnesota | 5,670,472 | 57,171 | 451 | 488 | 0.85 |
| 49 | Rhode Island | 1,091,949 | 7,526 | 61 | 63 | 0.84 |
| 50 | Massachusetts | 6,991,852 | 59,115 | 397 | 417 | 0.71 |

