Waverly, TN
Quality of Life, Demographics, And Statistics
HomeSnacks is reader-supported. When you click through real estate links on our site, we earn an affiliate commission. Learn more.
Waverly, Tennessee Info Snack
Table Of Contents
Population
4,117
Unemployment
13.3%
Poverty
16.0%
Median Home
$115,200
Median Income
$40,122
Median Rent
$602
Waverly SnackAbility
3
Overall SnackAbility
Overall SnackAbility
Jobs
4/10
Housing
5
Affordability
8
Diversity
5
Safety
8
Amenities
6
Education
5
Commute
4
Waverly, TN Crime Report
64
Total Crimes
Total Crimes
1,568.2
Total Crimes / 100k People
Total Crimes / 100k People
-36.68%
Below National Average
Below National Average
| Statistic | Count Raw |
Waverly / 100k People |
Tennessee / 100k People |
National / 100k People |
|---|---|---|---|---|
| Total Crimes Per 100K | 64 | 1,568.2 | 3,247.8 | 2,476.7 |
| Violent Crime | 4 | 98.0 | 595.2 | 366.7 |
| Murder | 0 | 0.0 | 7.3 | 5.0 |
| Robbery | 0 | 0.0 | 90.1 | 81.6 |
| Aggravated Assault | 4 | 98.0 | 456.7 | 250.2 |
| Property Crime | 60 | 1,470.2 | 2,652.6 | 2,109.9 |
| Burglary | 9 | 220.5 | 437.4 | 340.5 |
| Larceny | 50 | 1,225.2 | 1,934.4 | 1,549.5 |
| Car Theft | 1 | 24.5 | 280.9 | 219.9 |
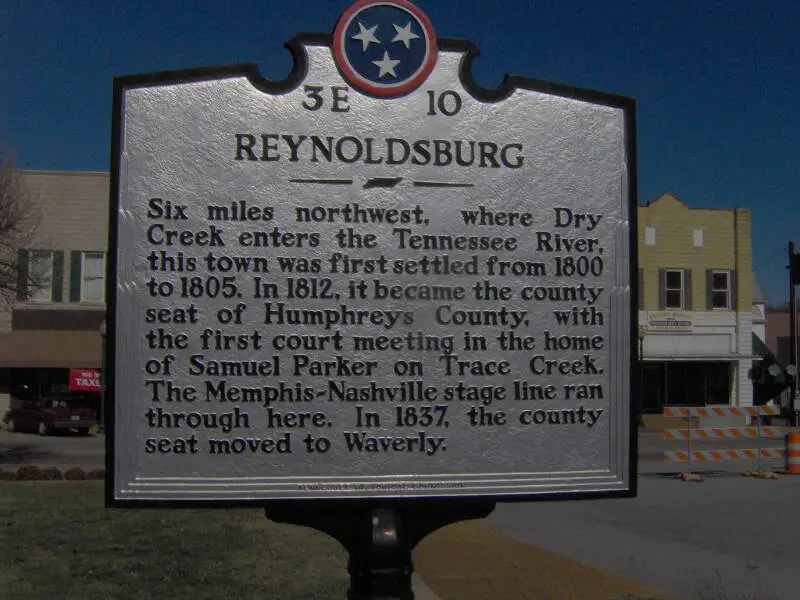
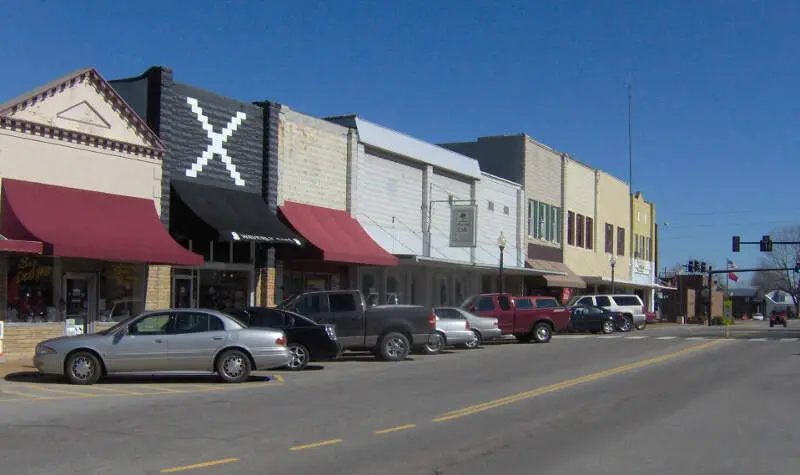
Waverly, TN Photos

Source: Wikipedia User Brian Stansberry | GFDL
Source: Wikipedia User Brian Stansberry | GFDL
Source: Wikipedia User Brian Stansberry | GFDL
Rankings for Waverly in Tennessee


Map Of Waverly, TN
Best Places Around Waverly
1
Clarksville, TN
Population 152,934
2
Murray, KY
Population 19,171
3
Dickson, TN
Population 15,447
4
Lexington, TN
Population 7,848
5
Oak Grove, KY
Population 7,338
6
McKenzie, TN
Population 5,328
7
Fort Campbell North, KY
Population 13,735
8
Ashland, VA
Population 7,750
9
Fairview, TN
Population 8,762
10
Paris, TN
Population 10,043
Population over time in Waverly
| Year | Population | % Change |
|---|---|---|
| 2019 | 4,117 | 1.2% |
| 2018 | 4,069 | -0.0% |
| 2017 | 4,070 | -1.1% |
| 2016 | 4,115 | 0.1% |
| 2015 | 4,111 | -0.0% |
| 2014 | 4,113 | -0.4% |
| 2013 | 4,128 | 0.3% |
| 2012 | 4,116 | 0.7% |
| 2011 | 4,087 | 0.2% |
| 2010 | 4,080 | - |
Race / Ethnicity in Waverly
| Race | Waverly | TN | USA |
|---|---|---|---|
| White | 90.6% | 73.8% | 60.7% |
| African American | 5.2% | 16.6% | 12.3% |
| American Indian | 0.0% | 0.2% | 0.7% |
| Asian | 0.0% | 1.7% | 5.5% |
| Hawaiian | 0.0% | 0.1% | 0.2% |
| Other | 0.0% | 0.2% | 0.2% |
| Two Or More | 0.4% | 2.0% | 2.4% |
| Hispanic | 3.8% | 5.4% | 18.0% |
Gender in Waverly
| Gender | Waverly | TN | USA |
|---|---|---|---|
| Female | 51.9% | 51.2% | 50.8% |
| Male | 48.1% | 48.8% | 49.2% |
Highest level of educational attainment in Waverly for adults over 25
| Education | Waverly | TN | USA |
|---|---|---|---|
| < 9th Grade | 3.0% | 5.0% | 6.0% |
| 9-12th Grade | 12.0% | 8.0% | 7.0% |
| High School / GED | 51.0% | 32.0% | 27.0% |
| Some College | 15.0% | 21.0% | 20.0% |
| Associate's Degree | 3.0% | 7.0% | 8.0% |
| Bachelor's Degree | 7.0% | 17.0% | 20.0% |
| Master's Degree | 7.0% | 7.0% | 9.0% |
| Professional Degree | 0.0% | 2.0% | 2.0% |
| Doctorate Degree | 2.0% | 1.0% | 1.0% |
Household Income For Waverly, Tennessee
| Income | Waverly | TN | USA |
|---|---|---|---|
| Less than $10,000 | 5.8% | 6.9% | 6.0% |
| $10,000 to $14,999 | 9.4% | 5.2% | 4.3% |
| $15,000 to $24,999 | 15.3% | 10.6% | 8.9% |
| $25,000 to $34,999 | 9.4% | 10.4% | 8.9% |
| $35,000 to $49,999 | 22.0% | 14.0% | 12.3% |
| $50,000 to $74,999 | 11.3% | 18.3% | 17.2% |
| $75,000 to $99,999 | 9.7% | 12.4% | 12.7% |
| $100,000 to $149,999 | 11.1% | 12.8% | 15.1% |
| $150,000 to $199,999 | 3.6% | 4.7% | 6.8% |
| $200,000 or more | 2.3% | 4.8% | 7.7% |


