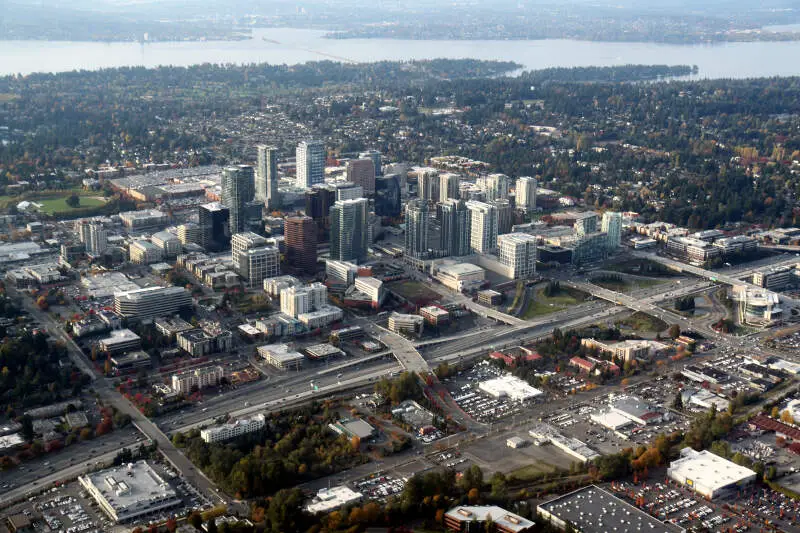
Bellevue, WA
Demographics And Statistics
Living In Bellevue, Washington Summary
Life in Bellevue research summary. HomeSnacks has been using Saturday Night Science to research the quality of life in Bellevue over the past nine years using Census, FBI, Zillow, and other primary data sources. Based on the most recently available data, we found the following about life in Bellevue:
The population in Bellevue is 151,199.
The median home value in Bellevue is $1,463,125.
The median income in Bellevue is $161,300.
The cost of living in Bellevue is 202 which is 2.0x higher than the national average.
The median rent in Bellevue is $2,505.
The unemployment rate in Bellevue is 4.0%.
The poverty rate in Bellevue is 7.3%.
The average high in Bellevue is 59.9° and the average low is 44.1°.
Bellevue SnackAbility
Overall SnackAbility
Bellevue, WA Crime Report
Crime in Bellevue summary. We use data from the FBI to determine the crime rates in Bellevue. Key points include:
There were 5,270 total crimes in Bellevue in the last reporting year.
The overall crime rate per 100,000 people in Bellevue is 3,478.1 / 100k people.
The violent crime rate per 100,000 people in Bellevue is 138.6 / 100k people.
The property crime rate per 100,000 people in Bellevue is 3,339.5 / 100k people.
Overall, crime in Bellevue is 64.12% above the national average.
Total Crimes
Above National Average
Crime In Bellevue Comparison Table
| Statistic | Count Raw |
Bellevue / 100k People |
Washington / 100k People |
National / 100k People |
|---|---|---|---|---|
| Total Crimes Per 100K | 5,270 | 3,478.1 | 2,792.6 | 2,119.2 |
| Violent Crime | 210 | 138.6 | 326.1 | 359.0 |
| Murder | 1 | 0.7 | 3.8 | 5.0 |
| Robbery | 77 | 50.8 | 67.5 | 61.0 |
| Aggravated Assault | 117 | 77.2 | 217.0 | 256.0 |
| Property Crime | 5,060 | 3,339.5 | 2,466.5 | 1,760.0 |
| Burglary | 549 | 362.3 | 398.8 | 229.0 |
| Larceny | 3,995 | 2,636.6 | 1,634.2 | 1,272.0 |
| Car Theft | 516 | 340.5 | 433.5 | 259.0 |
Bellevue, WA Cost Of Living
Cost of living in Bellevue summary. We use data on the cost of living to determine how expensive it is to live in Bellevue. Real estate prices drive most of the variance in cost of living around Washington. Key points include:
The cost of living in Bellevue is 202 with 100 being average.
The cost of living in Bellevue is 2.0x higher than the national average.
The median home value in Bellevue is $1,463,125.
The median income in Bellevue is $161,300.
Bellevue's Overall Cost Of Living
Higher Than The National Average
Cost Of Living In Bellevue Comparison Table
| Living Expense | Bellevue | Washington | National Average | |
|---|---|---|---|---|
| Overall | 202 | 118 | 100 | |
| Services | 118 | 111 | 100 | |
| Groceries | 117 | 112 | 100 | |
| Health | 139 | 122 | 100 | |
| Housing | 403 | 135 | 100 | |
| Transportation | 128 | 124 | 100 | |
| Utilities | 100 | 91 | 100 | |
Bellevue, WA Weather
The average high in Bellevue is 59.9° and the average low is 44.1°.
There are 97.7 days of precipitation each year.
Expect an average of 41.3 inches of precipitation each year with 4.9 inches of snow.
| Stat | Bellevue |
|---|---|
| Average Annual High | 59.9 |
| Average Annual Low | 44.1 |
| Annual Precipitation Days | 97.7 |
| Average Annual Precipitation | 41.3 |
| Average Annual Snowfall | 4.9 |
Average High
Days of Rain
Bellevue, WA Photos


Bellevue Articles

Rankings for Bellevue in Washington


Locations Around Bellevue
Map Of Bellevue, WA
Best Places Around Bellevue
Bainbridge Island, WA
Population 24,607
Vashon, WA
Population 10,424
SeaTac, WA
Population 31,143
Kent, WA
Population 135,015
Tukwila, WA
Population 21,479
Lake Stickney, WA
Population 15,514
White Center, WA
Population 15,017
Monroe, WA
Population 19,696
Lynnwood, WA
Population 40,953
Bryn Mawr-Skyway, WA
Population 17,577
Bellevue Demographics And Statistics
Population over time in Bellevue
The current population in Bellevue is 151,199. The population has increased 26.6% from 2010.
| Year | Population | % Change |
|---|---|---|
| 2023 | 151,199 | 0.4% |
| 2022 | 150,606 | 0.8% |
| 2021 | 149,365 | 2.2% |
| 2020 | 146,145 | 1.2% |
| 2019 | 144,403 | 1.5% |
| 2018 | 142,242 | 2.3% |
| 2017 | 139,014 | 1.7% |
| 2016 | 136,718 | 1.6% |
| 2015 | 134,630 | 1.8% |
| 2014 | 132,268 | 2.4% |
| 2013 | 129,209 | 5.2% |
| 2012 | 122,873 | 1.4% |
| 2011 | 121,134 | 1.4% |
| 2010 | 119,454 | - |
Race / Ethnicity in Bellevue
Bellevue is:
42.4% White with 64,109 White residents.
2.1% African American with 3,247 African American residents.
0.1% American Indian with 202 American Indian residents.
40.9% Asian with 61,797 Asian residents.
0.3% Hawaiian with 460 Hawaiian residents.
0.6% Other with 910 Other residents.
5.0% Two Or More with 7,606 Two Or More residents.
8.5% Hispanic with 12,868 Hispanic residents.
| Race | Bellevue | WA | USA |
|---|---|---|---|
| White | 42.4% | 64.3% | 58.2% |
| African American | 2.1% | 3.8% | 12.0% |
| American Indian | 0.1% | 0.8% | 0.5% |
| Asian | 40.9% | 9.3% | 5.7% |
| Hawaiian | 0.3% | 0.7% | 0.2% |
| Other | 0.6% | 0.5% | 0.5% |
| Two Or More | 5.0% | 6.5% | 3.9% |
| Hispanic | 8.5% | 14.1% | 19.0% |
Gender in Bellevue
Bellevue is 49.2% female with 74,326 female residents.
Bellevue is 50.8% male with 76,873 male residents.
| Gender | Bellevue | WA | USA |
|---|---|---|---|
| Female | 49.2% | 49.6% | 50.5% |
| Male | 50.8% | 50.4% | 49.5% |
Highest level of educational attainment in Bellevue for adults over 25
4.0% of adults in Bellevue completed < 9th grade.
2.0% of adults in Bellevue completed 9-12th grade.
8.0% of adults in Bellevue completed high school / ged.
10.0% of adults in Bellevue completed some college.
5.0% of adults in Bellevue completed associate's degree.
36.0% of adults in Bellevue completed bachelor's degree.
26.0% of adults in Bellevue completed master's degree.
5.0% of adults in Bellevue completed professional degree.
4.0% of adults in Bellevue completed doctorate degree.
| Education | Bellevue | WA | USA |
|---|---|---|---|
| < 9th Grade | 4.0% | 3.0% | 5.0% |
| 9-12th Grade | 2.0% | 4.0% | 6.0% |
| High School / GED | 8.0% | 22.0% | 26.0% |
| Some College | 10.0% | 22.0% | 19.0% |
| Associate's Degree | 5.0% | 10.0% | 9.0% |
| Bachelor's Degree | 36.0% | 24.0% | 21.0% |
| Master's Degree | 26.0% | 11.0% | 10.0% |
| Professional Degree | 5.0% | 2.0% | 2.0% |
| Doctorate Degree | 4.0% | 2.0% | 2.0% |
Household Income For Bellevue, Washington
2.6% of households in Bellevue earn Less than $10,000.
2.1% of households in Bellevue earn $10,000 to $14,999.
2.9% of households in Bellevue earn $15,000 to $24,999.
3.2% of households in Bellevue earn $25,000 to $34,999.
4.4% of households in Bellevue earn $35,000 to $49,999.
7.3% of households in Bellevue earn $50,000 to $74,999.
7.7% of households in Bellevue earn $75,000 to $99,999.
16.3% of households in Bellevue earn $100,000 to $149,999.
13.3% of households in Bellevue earn $150,000 to $199,999.
40.3% of households in Bellevue earn $200,000 or more.
| Income | Bellevue | WA | USA |
|---|---|---|---|
| Less than $10,000 | 2.6% | 3.8% | 4.9% |
| $10,000 to $14,999 | 2.1% | 2.7% | 3.6% |
| $15,000 to $24,999 | 2.9% | 4.9% | 6.6% |
| $25,000 to $34,999 | 3.2% | 5.3% | 6.8% |
| $35,000 to $49,999 | 4.4% | 8.6% | 10.4% |
| $50,000 to $74,999 | 7.3% | 14.6% | 15.7% |
| $75,000 to $99,999 | 7.7% | 12.6% | 12.7% |
| $100,000 to $149,999 | 16.3% | 19.2% | 17.4% |
| $150,000 to $199,999 | 13.3% | 11.3% | 9.3% |
| $200,000 or more | 40.3% | 17.2% | 12.6% |


