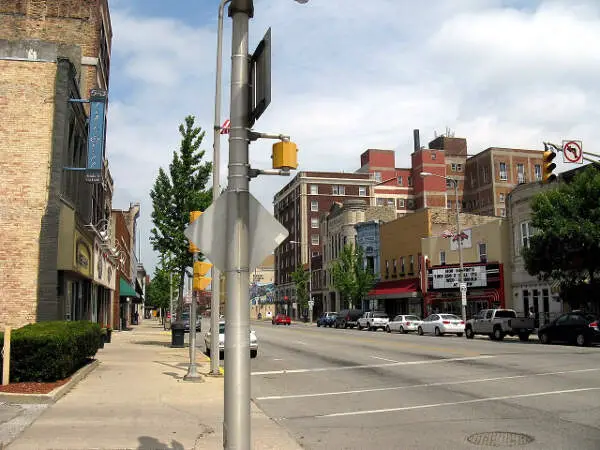
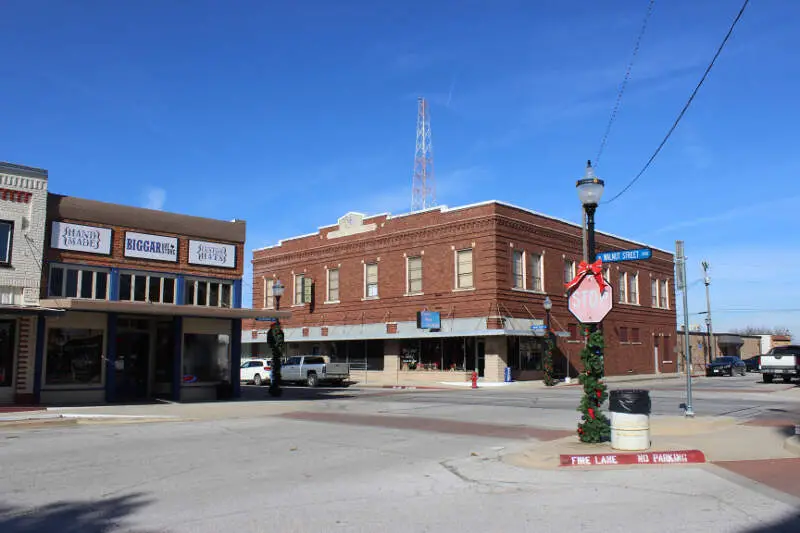
Mesa vs. Phoenix in photos
A side-by-side look at each city.





Cost of living
Phoenix is the cheaper city overall — 1% higher in Mesa than its rival. Index baseline: 100 = national average.
| Living expense | Mesa | Phoenix | US average |
|---|---|---|---|
| Overall | 112 | 111 | 100 |
| Services | 105 | 105 | 100 |
| Groceries | 105 | 104 | 100 |
| Health | 132 | 133 | 100 |
| Housing | 102 | 106 | 100 |
| Transportation | 113 | 112 | 100 |
| Utilities | 102 | 103 | 100 |
Lower index = cheaper. 100 = U.S. national average. Bar inside each cell scales relative to the highest value in the table.
Sources: HomeSnacks Cost of Living indices, normalized so 100 = U.S. national average. Drill in: Mesa cost of living, Phoenix cost of living, or the cheapest cities in America.
Housing breakdown
Home prices are higher in Mesa. Compare absolute price and price-to-income — a $500k home in a $100k-income city is very different from one in a $50k-income city.
| Metric | Mesa | Phoenix | United States |
|---|---|---|---|
| Median Home Value | $435,133 | $410,168 | $332,700 |
| Median Rent | $1,620 | $1,582 | $1,413 |
| Median Income | $82,752 | $81,332 | $80,734 |
| Home Value To Income | 5.3x | 5.0x | 4.1x |
| Rent To Monthly Income | 0.23x | 0.23x | 0.21x |
Source: U.S. Census Bureau ACS 2020-2024. See also states with the highest rent in America.
Crime
Mesa is the safer city — total crime rate of 1,947 per 100k people vs 3,125 for Phoenix. US average: 2,119.
| Crime (per 100k) | Mesa | Phoenix | US average |
|---|---|---|---|
| Total crime | 1,947 | 3,125 | 2,119 |
| Murder | 3 | 8 | 5 |
| Robbery | 50 | 182 | 61 |
| Aggravated Assault | 386 | 545 | 256 |
| Violent Crime | 483 | 800 | 359 |
| Burglary | 188 | 317 | 229 |
| Larceny | 1,078 | 1,582 | 1,272 |
| Car Theft | 198 | 426 | 259 |
| Property Crime | 1,465 | 2,325 | 1,760 |
Lower = safer. Bar inside each cell scales relative to the highest crime rate in the table.
Source: FBI Uniform Crime Reporting (2024). All rates are per 100,000 people. City pages: Mesa crime, Phoenix crime. See also: safest cities in America.
Diversity
Phoenix is more racially diverse — lower HHI (closer to 0) means a more even mix across groups.
| Group | Mesa | Phoenix | United States |
|---|---|---|---|
| White | 60.1% | 40.6% | 57.4% |
| African American | 3.7% | 7.4% | 11.9% |
| American Indian | 1.3% | 1.4% | 0.5% |
| Asian | 2.4% | 4.0% | 5.9% |
| Hawaiian | 0.2% | 0.2% | 0.2% |
| Other | 0.5% | 0.4% | 0.6% |
| Two Or More | 4.8% | 4.0% | 4.3% |
| Hispanic | 26.9% | 42.0% | 19.3% |
Source: U.S. Census ACS 2020-2024. Lower HHI = more even racial mix. See also: most diverse cities in America.
SnackAbility — overall quality of life
Mesa scores higher overall — 7/10 vs 6/10. SnackAbility is our 1–10 quality-of-life score; the median U.S. city scores a 7.
Scores are 0–10; both bars share the same scale.
SnackAbility is a HomeSnacks proprietary 1–10 score blending jobs, housing, education, commute, amenities, affordability, crime, and diversity. Median U.S. city ≈ 7. Data: Census, BLS, FBI. See also: best places to live in America.
Getting around: Mesa vs. Phoenix
How each city handles commuting, transit, walkability, and car culture — the day-to-day reality that shapes where you'd actually want to live.
Both Mesa and Phoenix sit inside the Valley Metro network. The Blue and Red lines connect downtown Mesa through Tempe and into central Phoenix in roughly 45 minutes. You'll almost certainly own a car in either city, though.
Phoenix, as the regional hub, has a denser freeway web (I-10, I-17, Loop 101, Loop 202) and a broader bus grid. That gives you more routing options, but also more congestion on SR-51 and the I-10 deck during rush hour. Mesa's street grid is more forgiving outside of US-60 and the Price Road corridor.
Home values are modestly higher in Mesa ($435,133 median vs. $410,168 in Phoenix). If reducing car dependence matters to you, factor in whether proximity to a light rail stop justifies the price difference.
Jobs and careers in Mesa vs. Phoenix
The local job market, dominant industries, and which city to choose based on your career.
Phoenix has far more employers. The state capital hosts major corporate campuses: Intel's fab operations, Banner Health's headquarters, American Express, and a growing cluster of financial services firms along the Camelback corridor. If you work in tech, healthcare, or finance, that density means shorter job searches and easier lateral moves.
Mesa holds its own in aerospace and manufacturing. Boeing has a significant maintenance facility at Phoenix-Mesa Gateway Airport, and Banner Desert Medical Center is a solid local healthcare employer.
Median household incomes are nearly identical: $82,752 in Mesa versus $81,332 in Phoenix. Phoenix's larger labor market tends to offer more senior-level and specialized roles, though. Remote workers will find cost of living nearly equal, with both cities sitting just above the national average (COL index 112 vs. 111).
Weather and climate
What to expect day-to-day — sun, fog, heat, rain, and the seasonal extremes that shape the lifestyle.
Both cities deal out the same punishing summers. Daytime highs regularly top 110°F from June through August, and nights rarely drop below 85°F during peak heat months. Winters are genuinely pleasant: January highs run in the low 60s°F, and frost is rare.
Both cities average well over 300 sunny days a year and receive only about 8 inches of annual rainfall, most of it during the July–September monsoon season.
The one real difference: Phoenix's urban core runs slightly hotter because of a more intense heat-island effect from greater pavement and building density. Summer nights in central Phoenix can feel a few degrees warmer than in Mesa's more suburban eastern neighborhoods. If you need a real autumn, you'll be driving to Flagstaff.
Culture, nightlife, and entertainment
Food, music, neighborhoods, and the city vibe that gives each place its personality.
Phoenix has a clear edge in arts, dining, and nightlife. Roosevelt Row on the east end of downtown is a walkable arts district with galleries, murals, and weekend markets. The Heard Museum has one of the country's best collections of Native American art, and Talking Stick Resort Arena and Chase Field keep sports fans busy year-round.
The Biltmore and Arcadia neighborhoods have some of the best restaurant and bar scenes in the Southwest.
Mesa has invested in its own downtown revival. The Mesa Arts Center hosts touring productions and a real gallery scene, and the area around Main Street and Center has added craft breweries and independent restaurants in recent years. But Mesa reads more suburban in character; if late-night options and cultural variety matter, Phoenix has more across every category.
Outdoor activities and day trips
Parks, beaches, hikes, and the weekend escapes that define life outside the city limits.
Mesa gives you quick access to Usery Mountain Regional Park, an underrated desert hiking destination with the Wind Cave Trail and panoramic views of the Superstition Mountains. The Superstition Wilderness, with trailheads at Lost Dutchman State Park about 15 miles east, offers serious backcountry hiking and a full-day escape from the valley. Salt River tubing launches from just northeast of Mesa, making it a summer staple.
Phoenix's anchor is South Mountain Park, one of the largest municipal parks in the country, with over 50 miles of trails threading through saguaro-studded desert. Piestewa Peak and Camelback Mountain (Echo Canyon and Cholla trails) are iconic, though expect crowds on weekends.
Both cities put you within two hours of world-class options: Sedona's red rocks to the north and the Mogollon Rim for cooler elevation hikes in summer.
Bottom line: which city is right for you?
Based on the head-to-head data above, here's the short version — pick the city that lines up with what you actually care about.
Choose Mesa if you prioritize…
- lower crime — a safer place to live, work, and raise a family.
- more affordable housing relative to Phoenix.
- a higher overall SnackAbility quality-of-life score.
Choose Phoenix if you prioritize…
- a lower cost of living (cheaper groceries, services, and day-to-day expenses).
- a more racially diverse community (lower HHI on Census data).
Methodology: winners are picked from public data — U.S. Census Bureau ACS (income, home value, rent, race/HHI), FBI Uniform Crime Reporting (crime rates per 100k), and HomeSnacks' proprietary SnackAbility quality-of-life score, which blends Bureau of Labor Statistics data with the above.
Other comparisons
Still weighing your options? See how these two cities stack up against other places we've compared head-to-head.