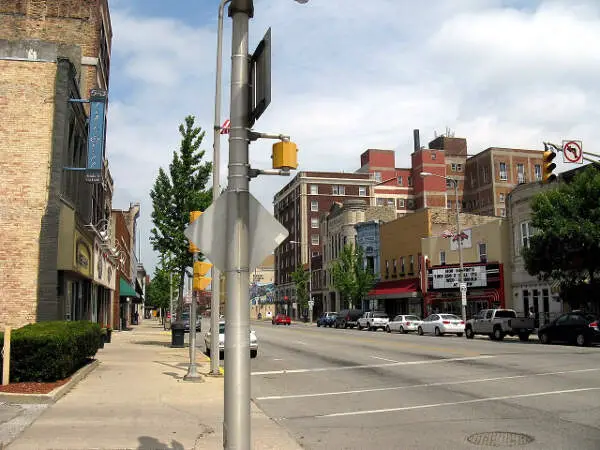
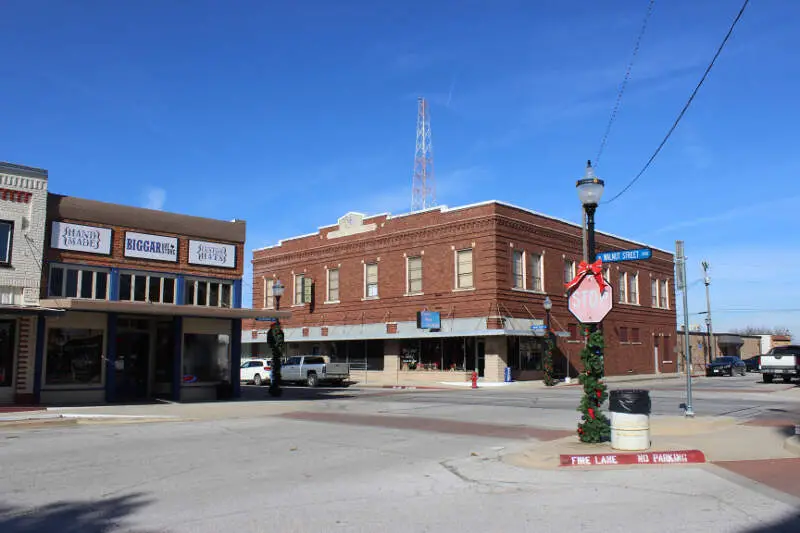
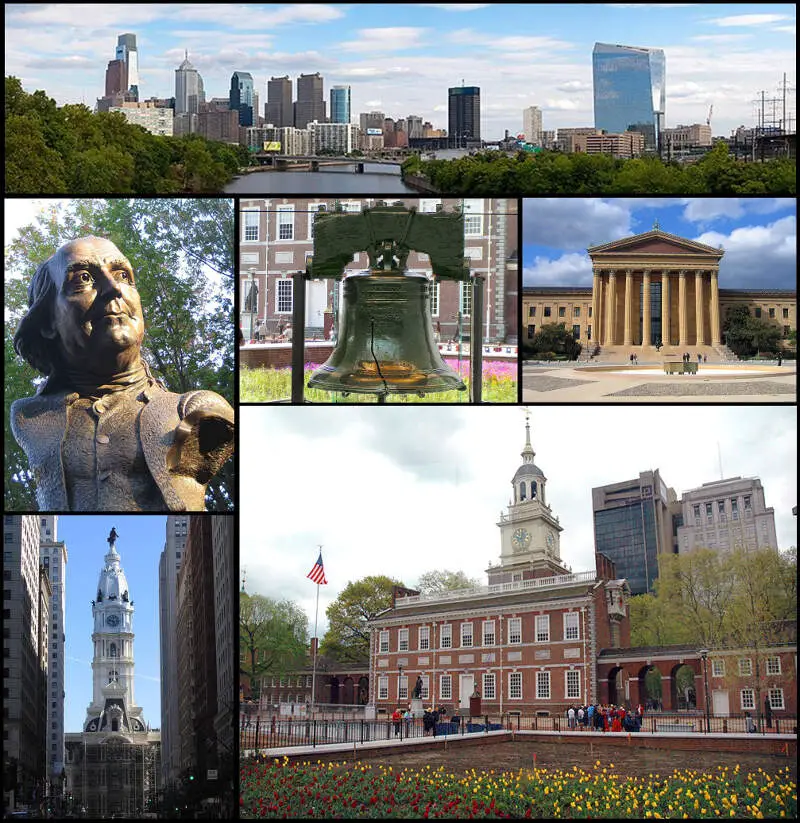
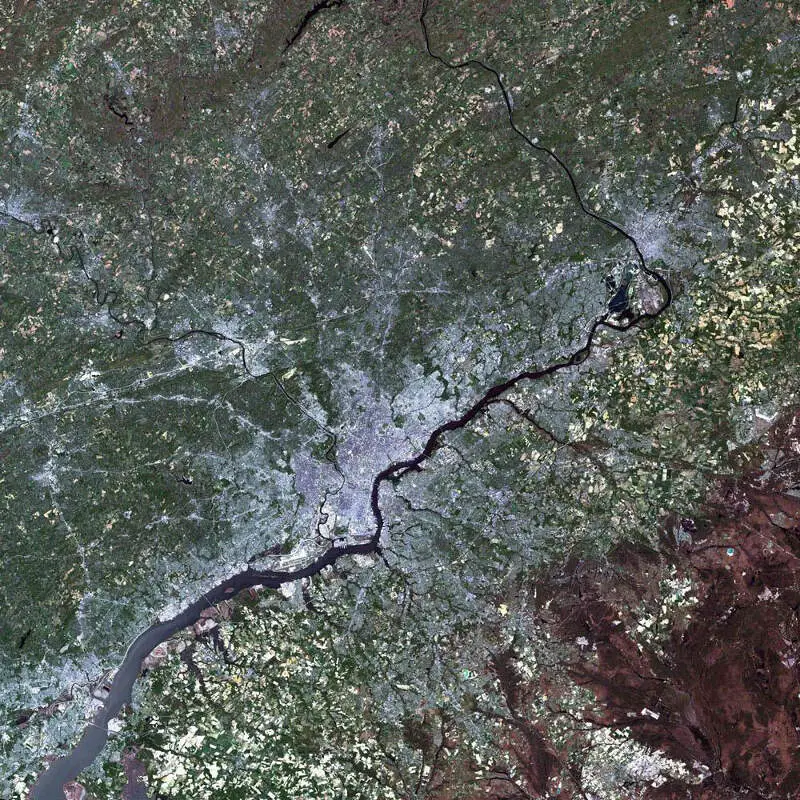
Philadelphia vs. Boston in photos
A side-by-side look at each city.

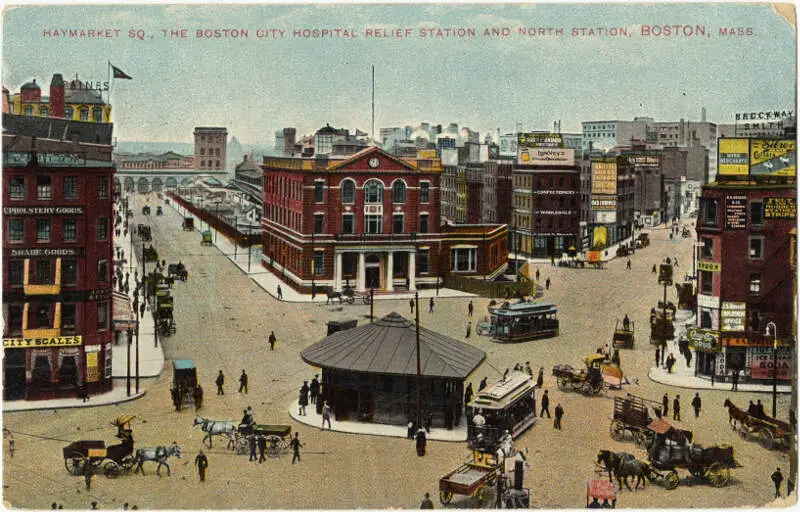
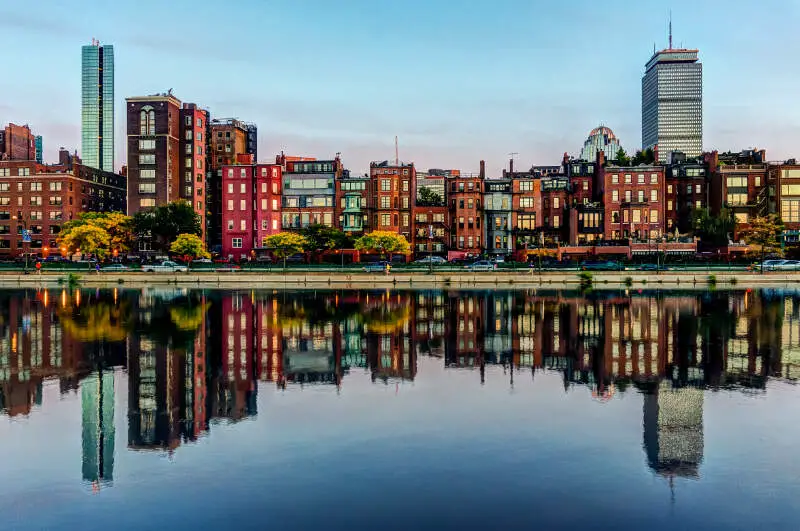

Cost of living
Philadelphia is the cheaper city overall — 40% higher in Boston than its rival. Index baseline: 100 = national average.
| Living expense | Philadelphia | Boston | US average |
|---|---|---|---|
| Overall | 103 | 171 | 100 |
| Services | 103 | 109 | 100 |
| Groceries | 100 | 122 | 100 |
| Health | 101 | 276 | 100 |
| Housing | 107 | 120 | 100 |
| Transportation | 99 | 127 | 100 |
| Utilities | 112 | 132 | 100 |
Lower index = cheaper. 100 = U.S. national average. Bar inside each cell scales relative to the highest value in the table.
Sources: HomeSnacks Cost of Living indices, normalized so 100 = U.S. national average. Drill in: Philadelphia cost of living, Boston cost of living, or the cheapest cities in America.
Housing breakdown
Home prices are higher in Boston. Compare absolute price and price-to-income — a $500k home in a $100k-income city is very different from one in a $50k-income city.
| Metric | Philadelphia | Boston | United States |
|---|---|---|---|
| Median Home Value | $231,814 | $798,216 | $332,700 |
| Median Rent | $1,397 | $2,147 | $1,413 |
| Median Income | $61,953 | $97,344 | $80,734 |
| Home Value To Income | 3.7x | 8.2x | 4.1x |
| Rent To Monthly Income | 0.27x | 0.26x | 0.21x |
Source: U.S. Census Bureau ACS 2020-2024. See also states with the highest rent in America.
Crime
Boston is the safer city — total crime rate of 2,650 per 100k people vs 5,457 for Philadelphia. US average: 2,119.
| Crime (per 100k) | Philadelphia | Boston | US average |
|---|---|---|---|
| Total crime | 5,457 | 2,650 | 2,119 |
| Murder | 17 | 4 | 5 |
| Robbery | 273 | 126 | 61 |
| Aggravated Assault | 572 | 472 | 256 |
| Violent Crime | 909 | 628 | 359 |
| Burglary | 319 | 178 | 229 |
| Larceny | 3,224 | 1,687 | 1,272 |
| Car Theft | 1,006 | 157 | 259 |
| Property Crime | 4,548 | 2,022 | 1,760 |
Lower = safer. Bar inside each cell scales relative to the highest crime rate in the table.
Source: FBI Uniform Crime Reporting (2024). All rates are per 100,000 people. City pages: Philadelphia crime, Boston crime. See also: safest cities in America.
Diversity
Boston is more racially diverse — lower HHI (closer to 0) means a more even mix across groups.
| Group | Philadelphia | Boston | United States |
|---|---|---|---|
| White | 33.2% | 44.1% | 57.4% |
| African American | 38.3% | 19.3% | 11.9% |
| American Indian | 0.1% | 0.1% | 0.5% |
| Asian | 7.9% | 10.3% | 5.9% |
| Hawaiian | 0.0% | 0.0% | 0.2% |
| Other | 0.8% | 1.0% | 0.6% |
| Two Or More | 4.1% | 5.9% | 4.3% |
| Hispanic | 15.6% | 19.3% | 19.3% |
Source: U.S. Census ACS 2020-2024. Lower HHI = more even racial mix. See also: most diverse cities in America.
SnackAbility — overall quality of life
Boston scores higher overall — 8/10 vs 6/10. SnackAbility is our 1–10 quality-of-life score; the median U.S. city scores a 7.
Scores are 0–10; both bars share the same scale.
SnackAbility is a HomeSnacks proprietary 1–10 score blending jobs, housing, education, commute, amenities, affordability, crime, and diversity. Median U.S. city ≈ 7. Data: Census, BLS, FBI. See also: best places to live in America.
Getting around: Philadelphia vs. Boston
How each city handles commuting, transit, walkability, and car culture — the day-to-day reality that shapes where you'd actually want to live.
Both cities run on legacy transit networks that predate the car, which is either a selling point or a daily frustration depending on your neighborhood. In Philadelphia, SEPTA covers the city with the Market-Frankford El, four subway-surface trolley lines, regional rail, and an extensive bus grid: you can commute car-free from most of Center City, Fishtown, or West Philly without much trouble. Parking is cheaper and more available than in Boston, and the grid layout makes driving less chaotic.
Boston's MBTA (locals call it the T) covers a smaller geographic footprint but punches above its weight in the core neighborhoods of Back Bay, Cambridge, and the South End. The trade-off is that driving in Boston is genuinely punishing: one-way streets, rotaries, and some of the most aggressive traffic in the Northeast.
If you're commuting by car, Philadelphia is the more forgiving of the two. If you're car-free, both cities work, but Boston's density clusters amenities closer together.
Jobs and careers in Philadelphia vs. Boston
The local job market, dominant industries, and which city to choose based on your career.
The income gap between these two cities is wide and structural. Boston's median household income of $97,344 (versus Philadelphia's $61,953) reflects a labor market dominated by biotech, finance, and university-affiliated research. Kendall Square in Cambridge is home to more pharmaceutical and life-sciences firms per square mile than almost anywhere in the country, and anchor institutions like Harvard, MIT, Mass General, and Fidelity generate a deep professional services network around them.
Philadelphia's job market is anchored by healthcare and education: Penn Medicine, Jefferson Health, CHOP, and Drexel are major employers, and there's a growing tech scene around University City. Entry-level and mid-career salaries tend to be lower, but the cost of living index of 103 (versus Boston's 171) means your dollar goes considerably further.
If you're early in a career and value affordability, Philadelphia can offer a better lifestyle-adjusted outcome. If you're chasing top-tier salaries in biotech or finance, Boston's compensation ceiling is significantly higher.
Weather and climate
What to expect day-to-day — sun, fog, heat, rain, and the seasonal extremes that shape the lifestyle.
These two cities share a mid-Atlantic to southern New England climate, but Boston runs noticeably colder and snowier. Expect sustained stretches below freezing from December through February, and nor'easters that dump a foot or more of snow (the blizzard of 2015 is still a reference point for locals). Summers are warm and humid, though Boston's harbor location keeps July and August slightly more bearable than Philadelphia's inland heat.
Philadelphia winters are milder on average, with fewer extreme cold snaps and less accumulated snow. Summers are legitimately hot, though: humid stretches in July and August regularly push feels-like temperatures above 100°F. Spring and fall are excellent in both cities, with crisp air and comfortable temperatures.
If you struggle with cold and snow, Philadelphia has a modest edge in winter livability. If oppressive summer heat is your concern, Boston offers a bit more relief from late July through August.
Culture, nightlife, and entertainment
Food, music, neighborhoods, and the city vibe that gives each place its personality.
Philadelphia's cultural footprint is bigger than its reputation suggests. The Philadelphia Museum of Art, Barnes Foundation, and Eastern State Penitentiary all sit within a short distance of each other near Fairmount, and neighborhoods like Fishtown, Northern Liberties, and Old City host an independent bar and restaurant scene that's become genuinely destination-worthy. The Italian Market in South Philly and Reading Terminal Market downtown are living institutions, not tourist traps.
Philly's music venues, from the TLA to the Fillmore, consistently book major acts. The city also has a deep sports culture that's hard to overstate.
Boston's cultural density is comparable but differently distributed. The North End is one of the best Italian neighborhoods in the country, Fenway and Kenmore Square anchor a bar district around Red Sox season, and neighborhoods like Jamaica Plain and Somerville carry a strong arts and independent dining scene.
The Museum of Fine Arts and the Isabella Stewart Gardner Museum are world-class. Both cities have real character. Boston slightly edges Philadelphia on overall polish and walkable nightlife concentration, but Philly punches well above its cost bracket.
Outdoor activities and day trips
Parks, beaches, hikes, and the weekend escapes that define life outside the city limits.
Philadelphia's primary green lung is Fairmount Park, one of the largest urban park systems in the country. The Wissahickon Valley offers trail running and mountain biking inside city limits, a rare amenity for a city this size, and the Schuylkill River Trail connects the Art Museum steps to Valley Forge and beyond. For weekend escapes, the Jersey Shore is roughly 90 minutes east, the Poconos are two hours north, and the Delaware Water Gap draws hikers and kayakers in every season.
Boston's outdoors access is different in character but equally strong. The Harbor Islands State Park is reachable by ferry from Long Wharf: swimming beaches and hiking within 30 minutes of downtown, something Philadelphia can't match. Cape Cod and the Berkshires are classic day trips, and the Blue Hills Reservation south of the city offers serious trail options close in.
Boston's median home value of $798,216 versus Philadelphia's $231,814 means you're paying a steep premium for that coastal access. If waterfront recreation is central to your lifestyle, though, the Boston area's geography delivers it in a way Philadelphia can't replicate.
Bottom line: which city is right for you?
Based on the head-to-head data above, here's the short version — pick the city that lines up with what you actually care about.
Choose Philadelphia if you prioritize…
- a lower cost of living (cheaper groceries, services, and day-to-day expenses).
Choose Boston if you prioritize…
- lower crime — a safer place to live, work, and raise a family.
- more affordable housing relative to Philadelphia.
- a more racially diverse community (lower HHI on Census data).
- a higher overall SnackAbility quality-of-life score.
Methodology: winners are picked from public data — U.S. Census Bureau ACS (income, home value, rent, race/HHI), FBI Uniform Crime Reporting (crime rates per 100k), and HomeSnacks' proprietary SnackAbility quality-of-life score, which blends Bureau of Labor Statistics data with the above.
Other comparisons
Still weighing your options? See how these two cities stack up against other places we've compared head-to-head.